
What data is available at the course level for Students in Need of Attention?
Students in Need of Attention at the course level provides teachers with the tools you need to be proactive and efficient in supporting your students. It empowers teachers to directly identify and support students, based on criteria that truly matter for their courses. By streamlining the process of identifying and reaching out to those who need help, teachers can save time.
What data is available at the course level for Students in Need of Attention?
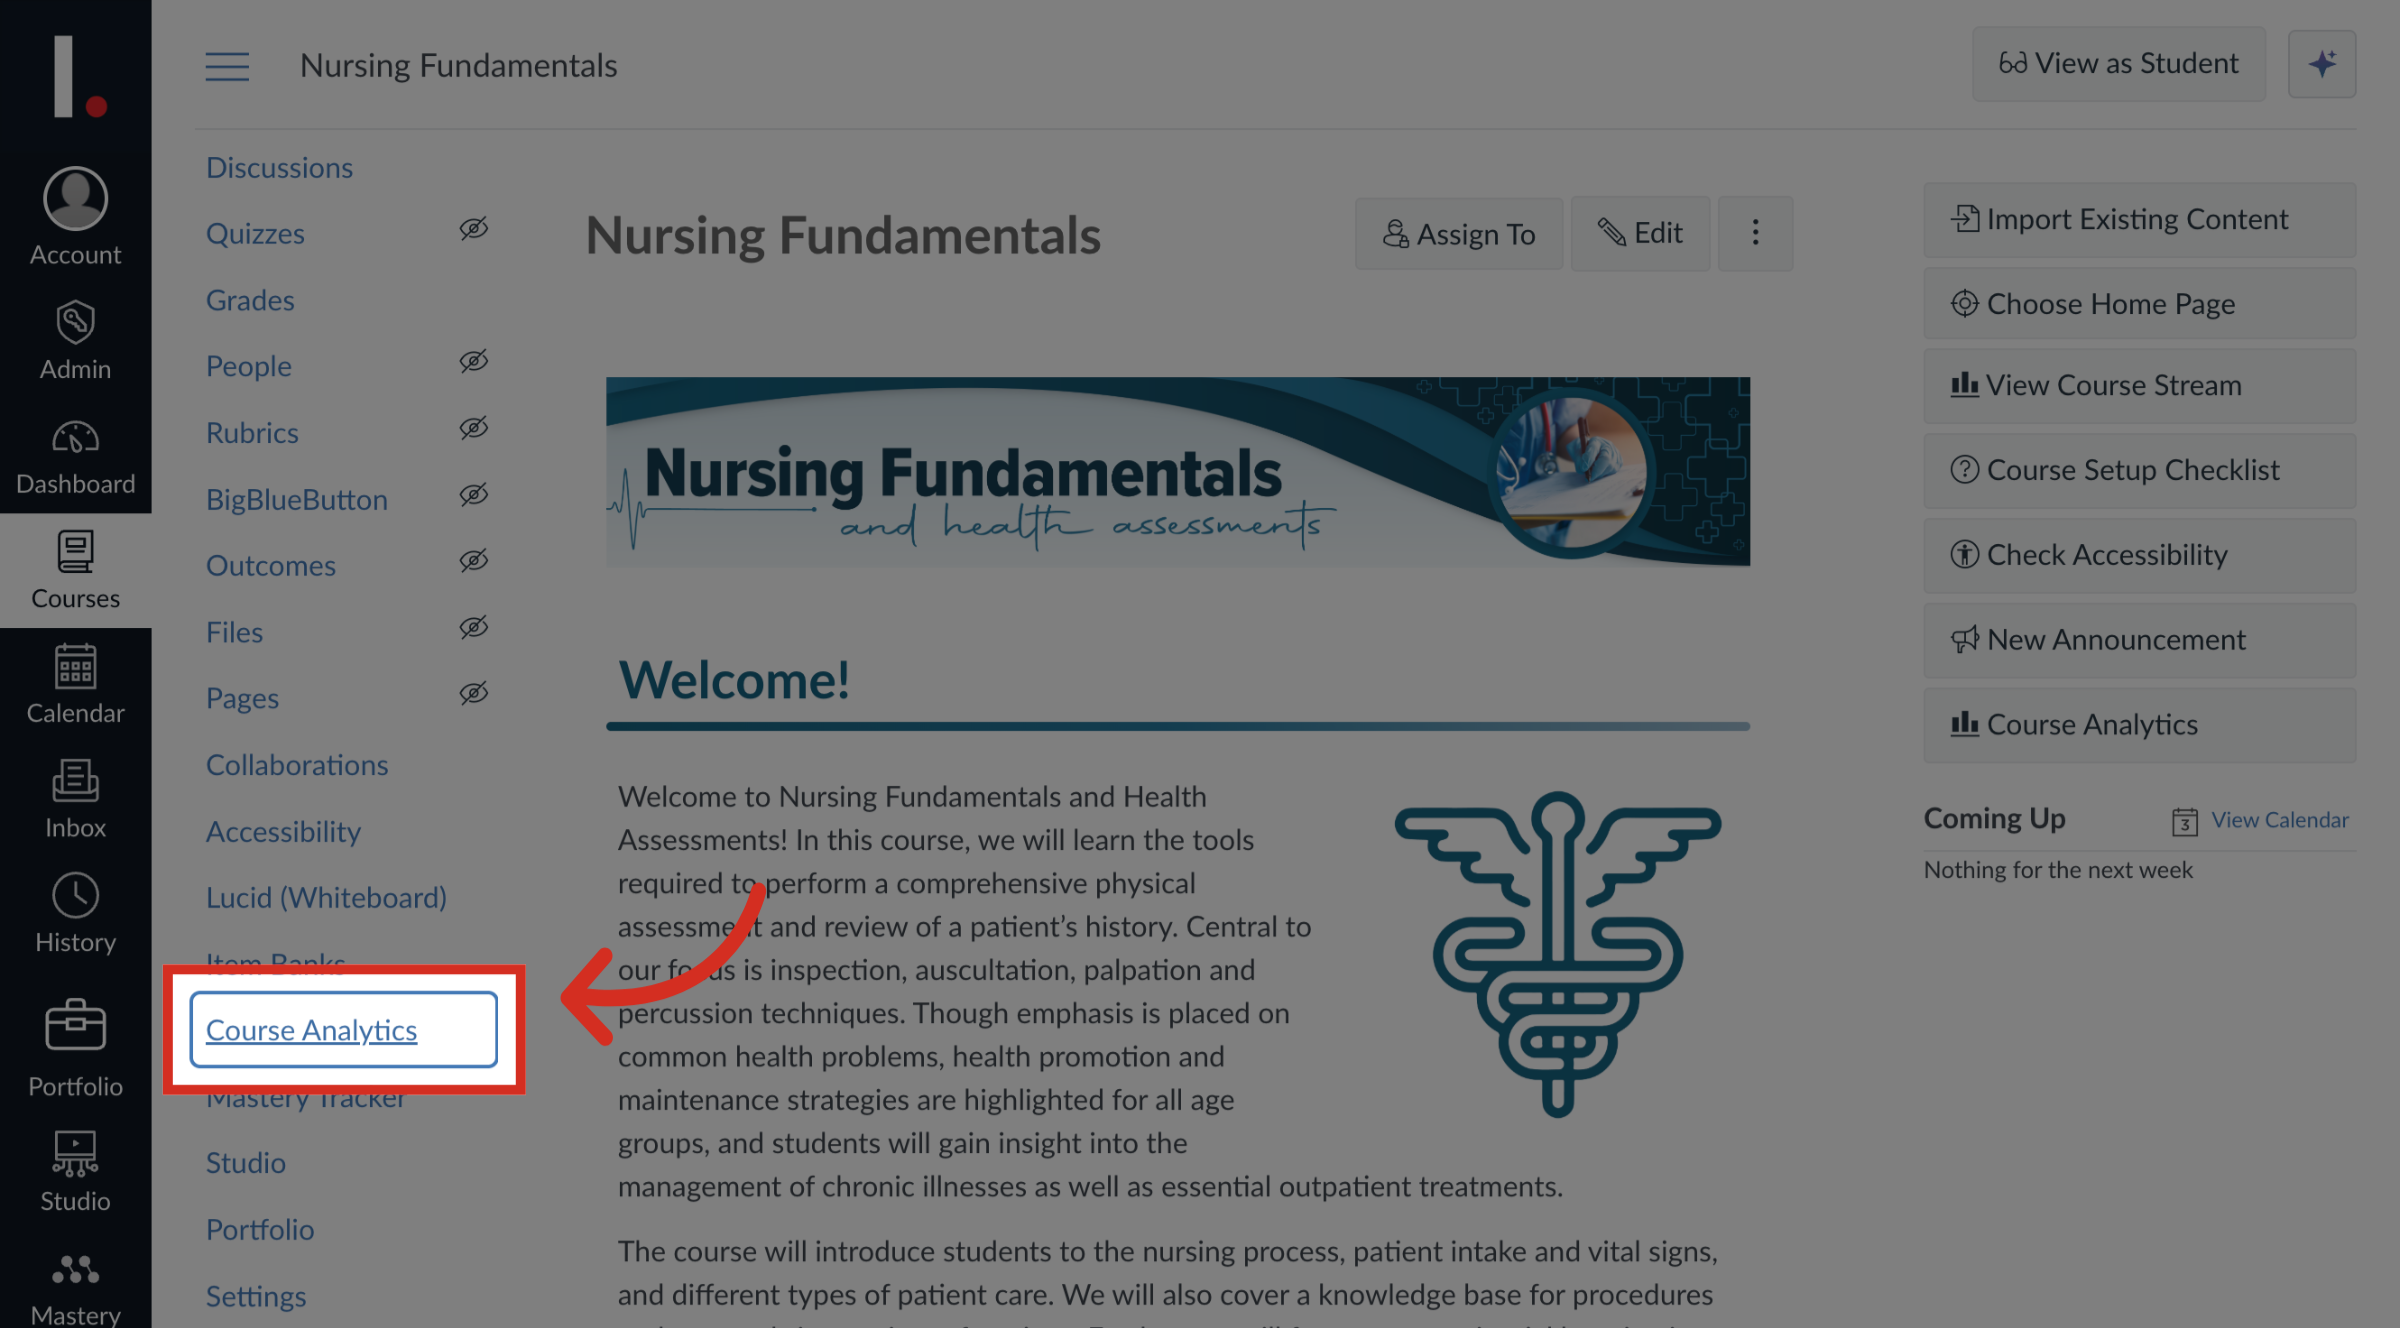
1. Open Course Analytics
In Course Navigation, click the Course Analytics link.
2. Course Analytics: Students in Need of Attention
In the Course Analytics, you can view Students in Need of Attention and identify and reach out to students who might be struggling or might be struggling in the future based on selected criteria.
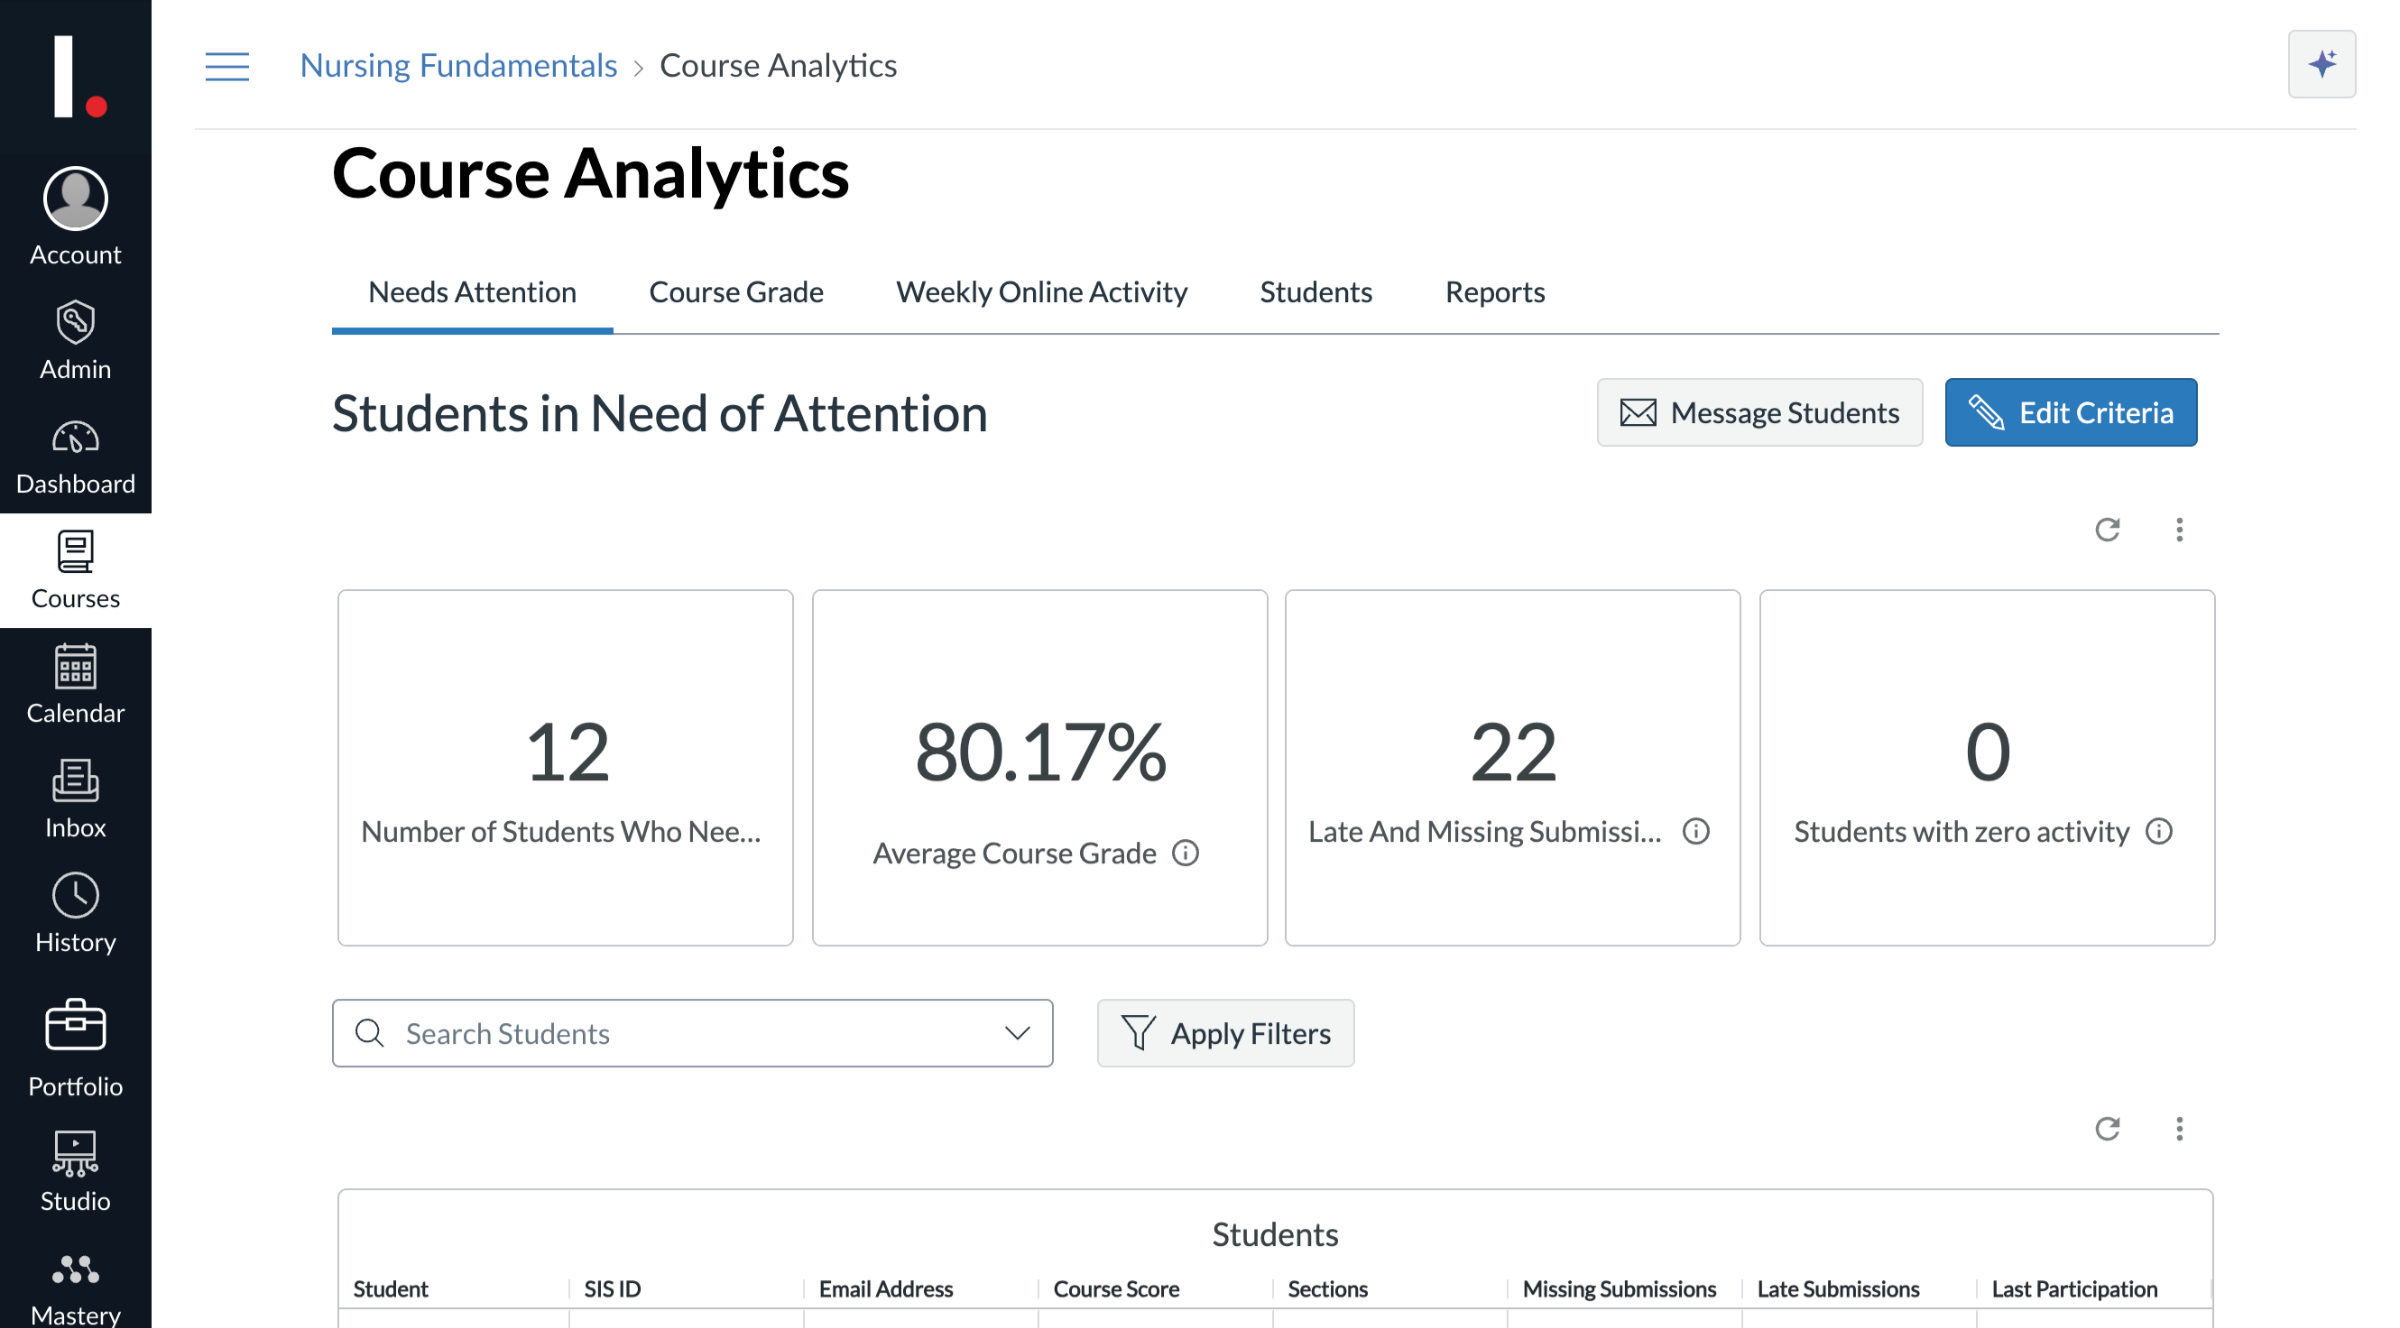
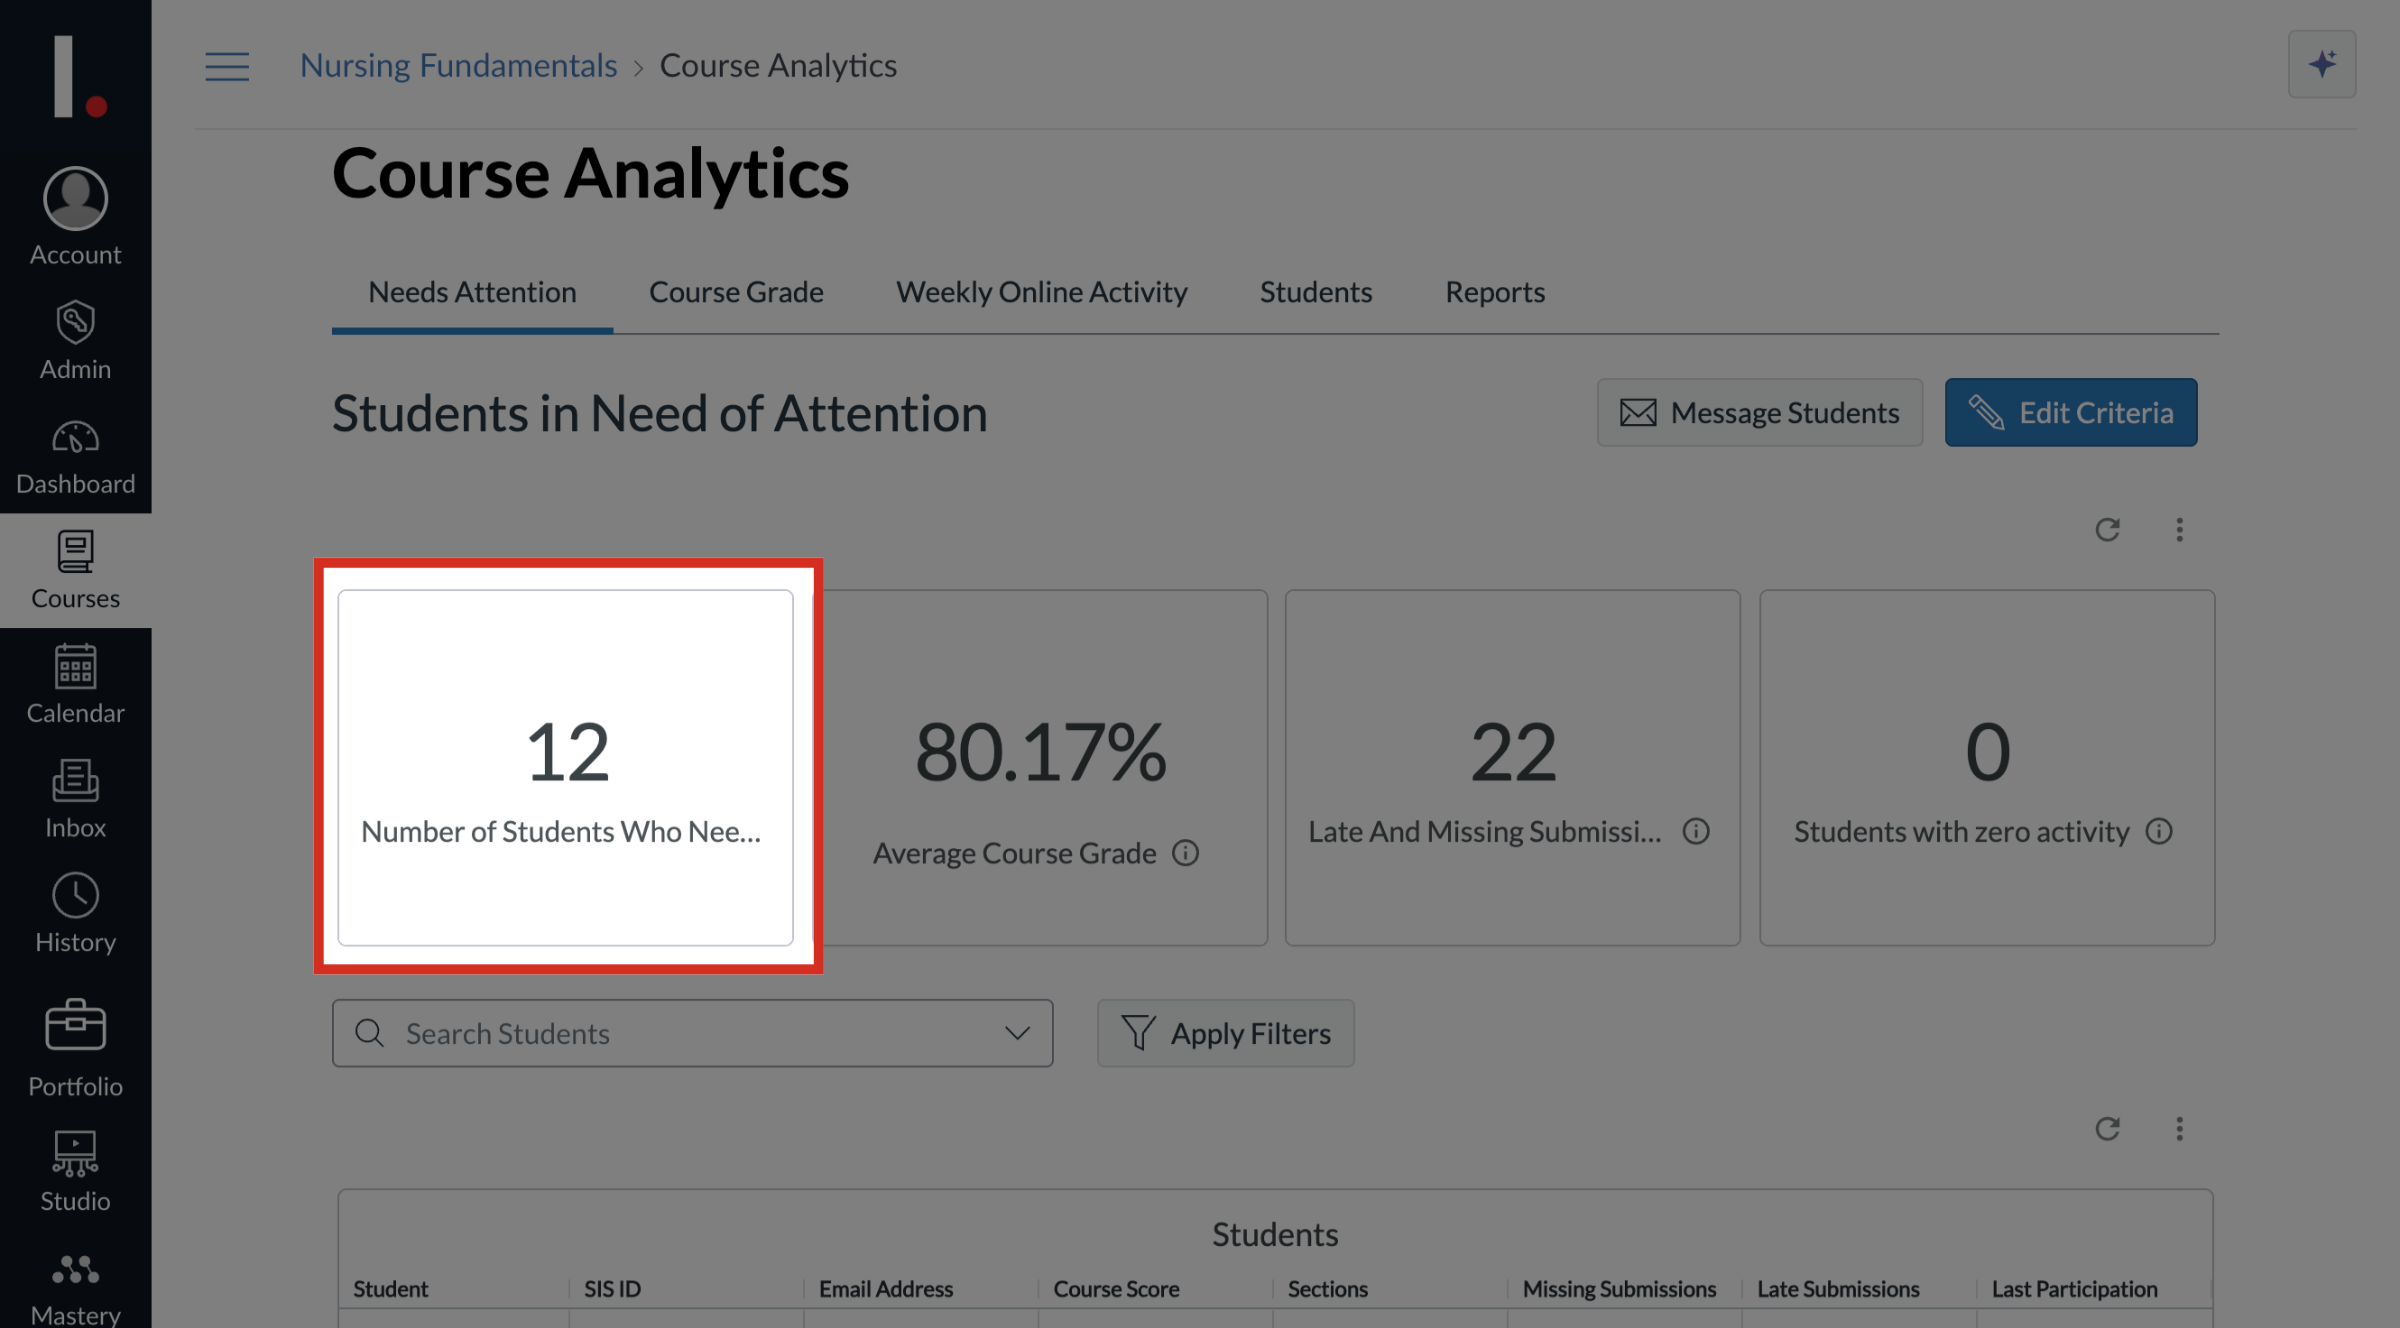
3. Number of Students Who Need Attention
The Number of Students Who Need Attention tile displays the number of students that meet the criteria for Needs Attention
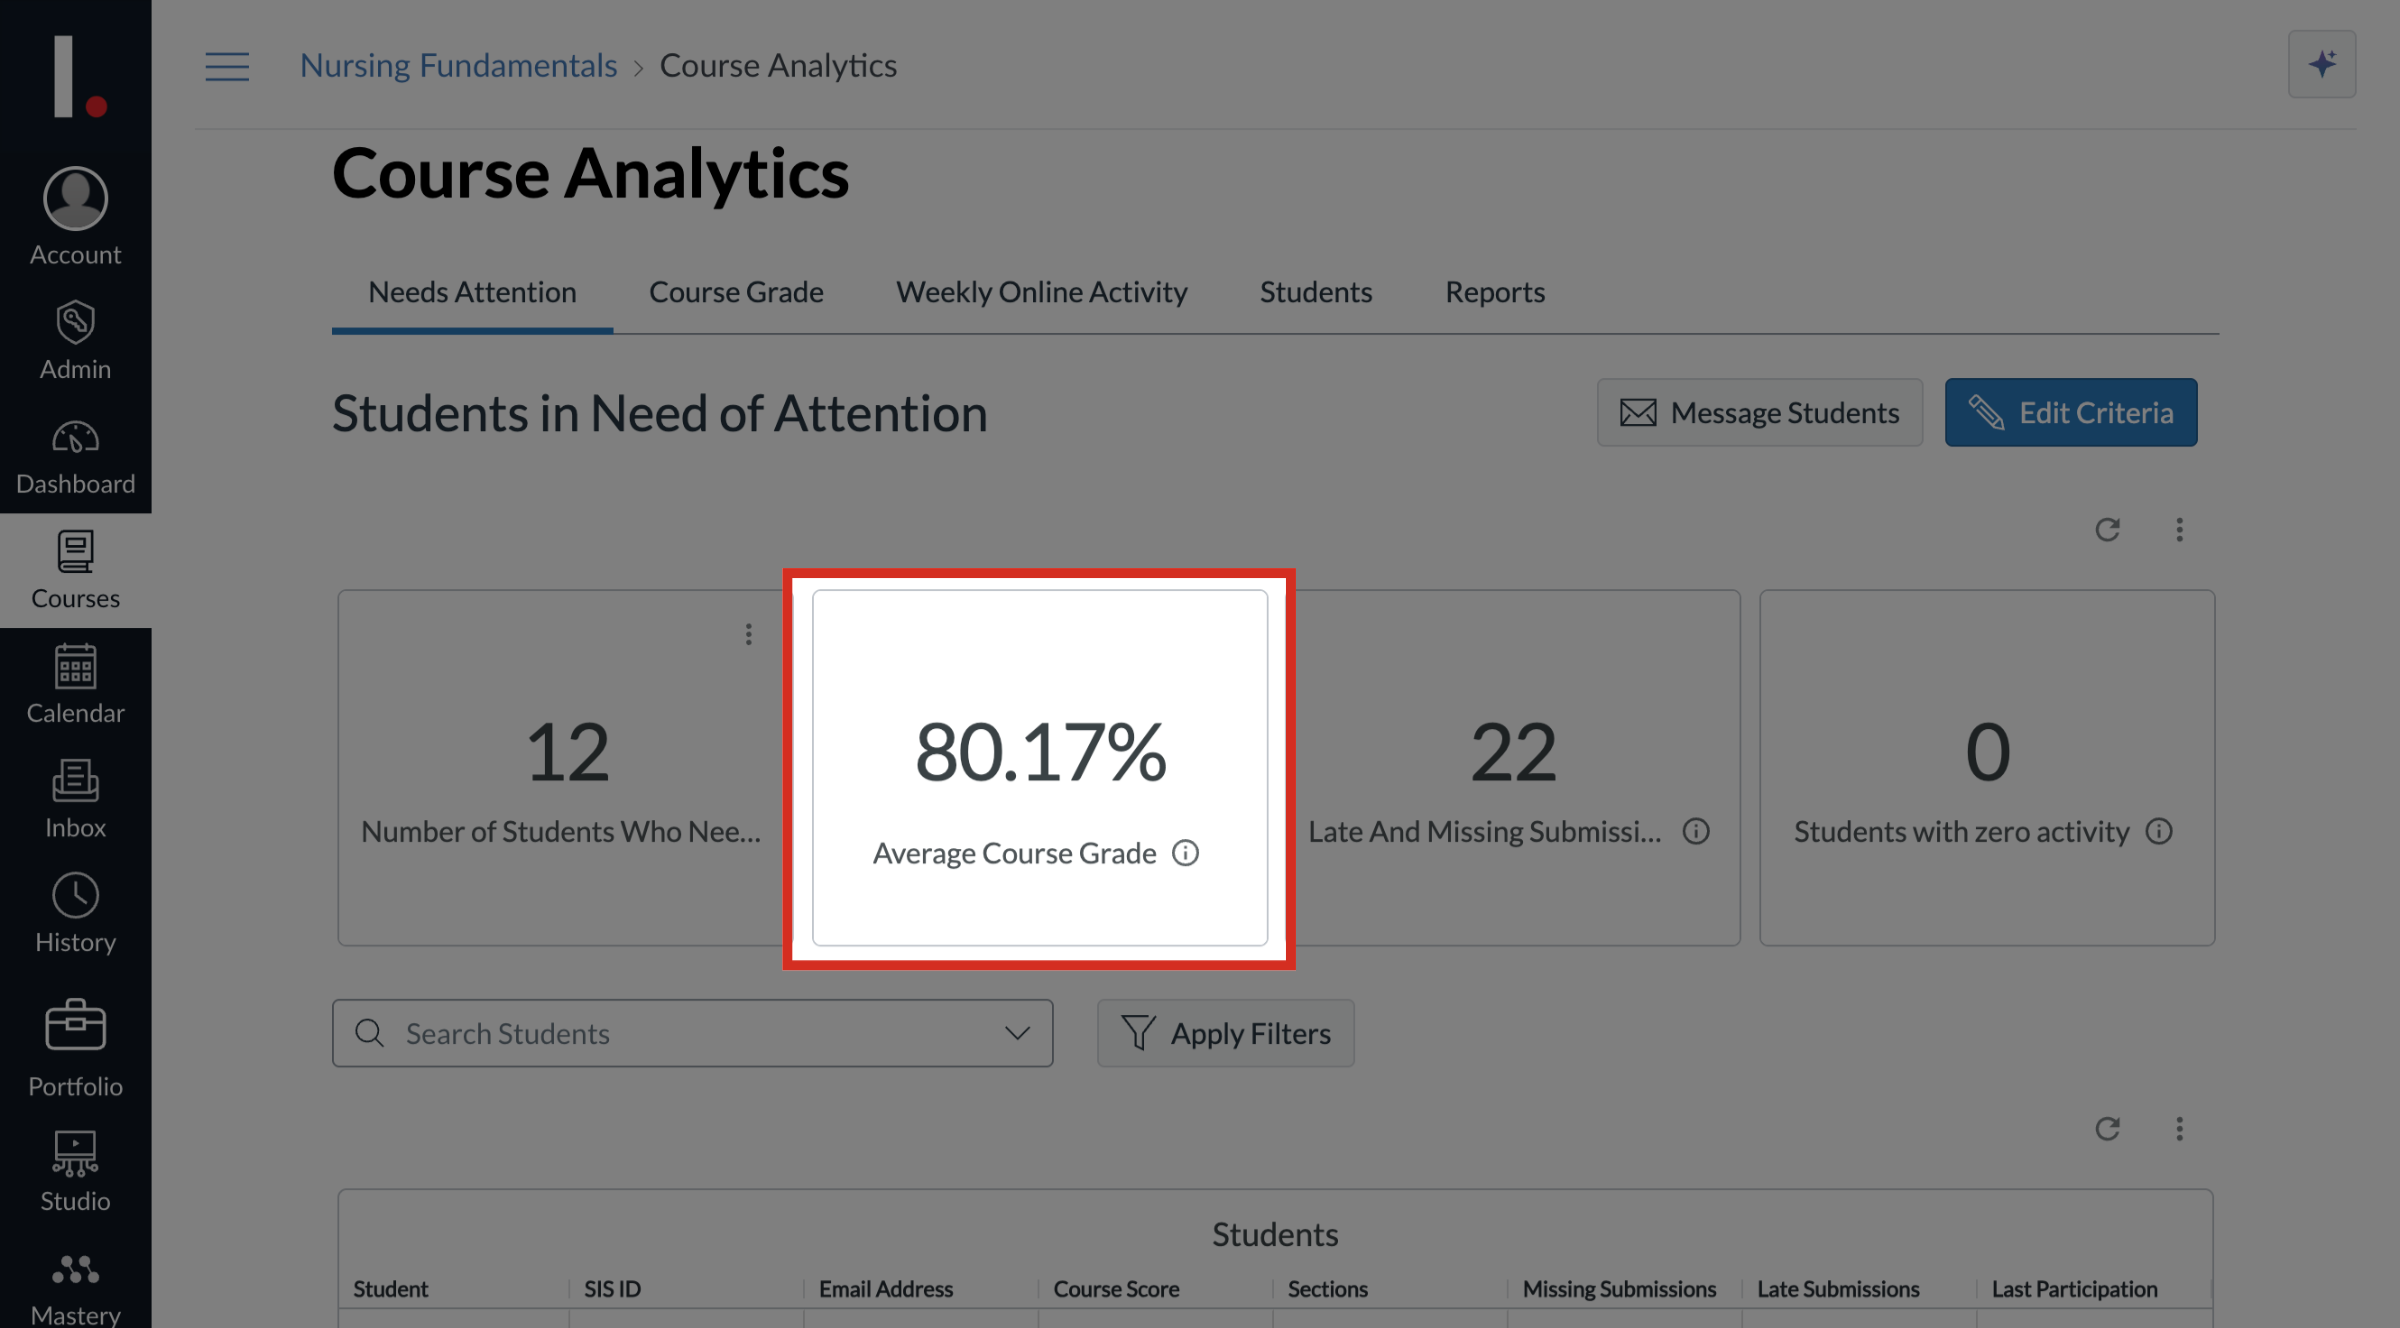
4. Average Course Grade
The Average Course Grade tile displays the average current score for all students in need of attention.
5. Late and Missing Submissions
The Late and Missing Submissions tile displays the sum total of all late and missing submissions by students in need of attention.
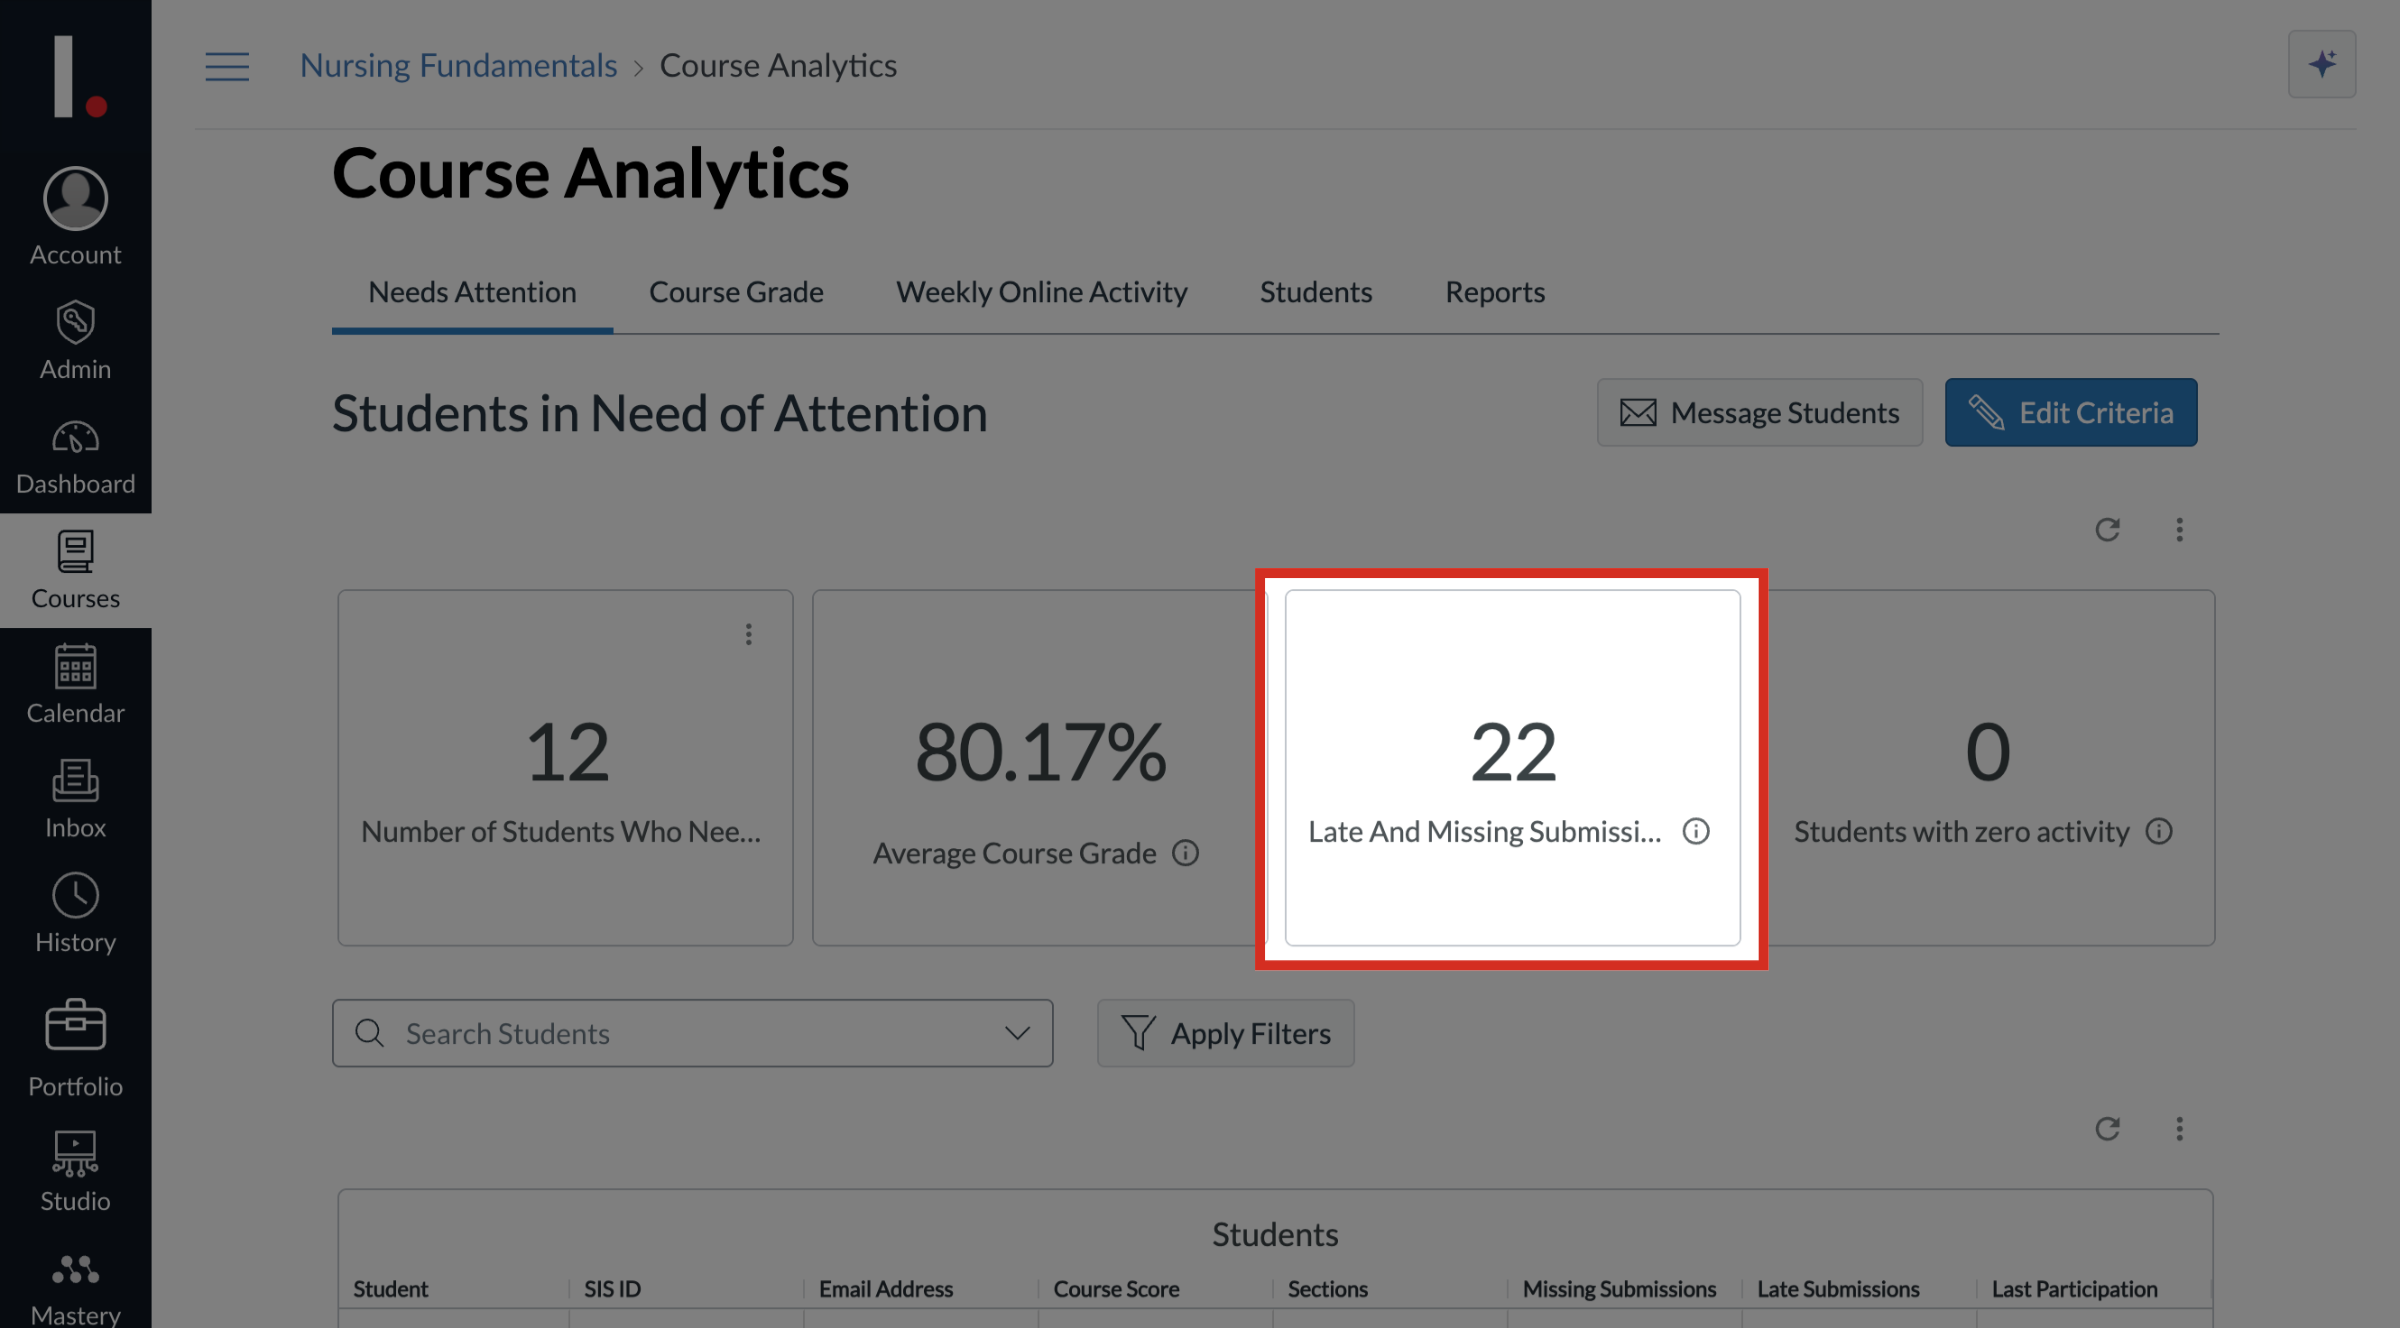
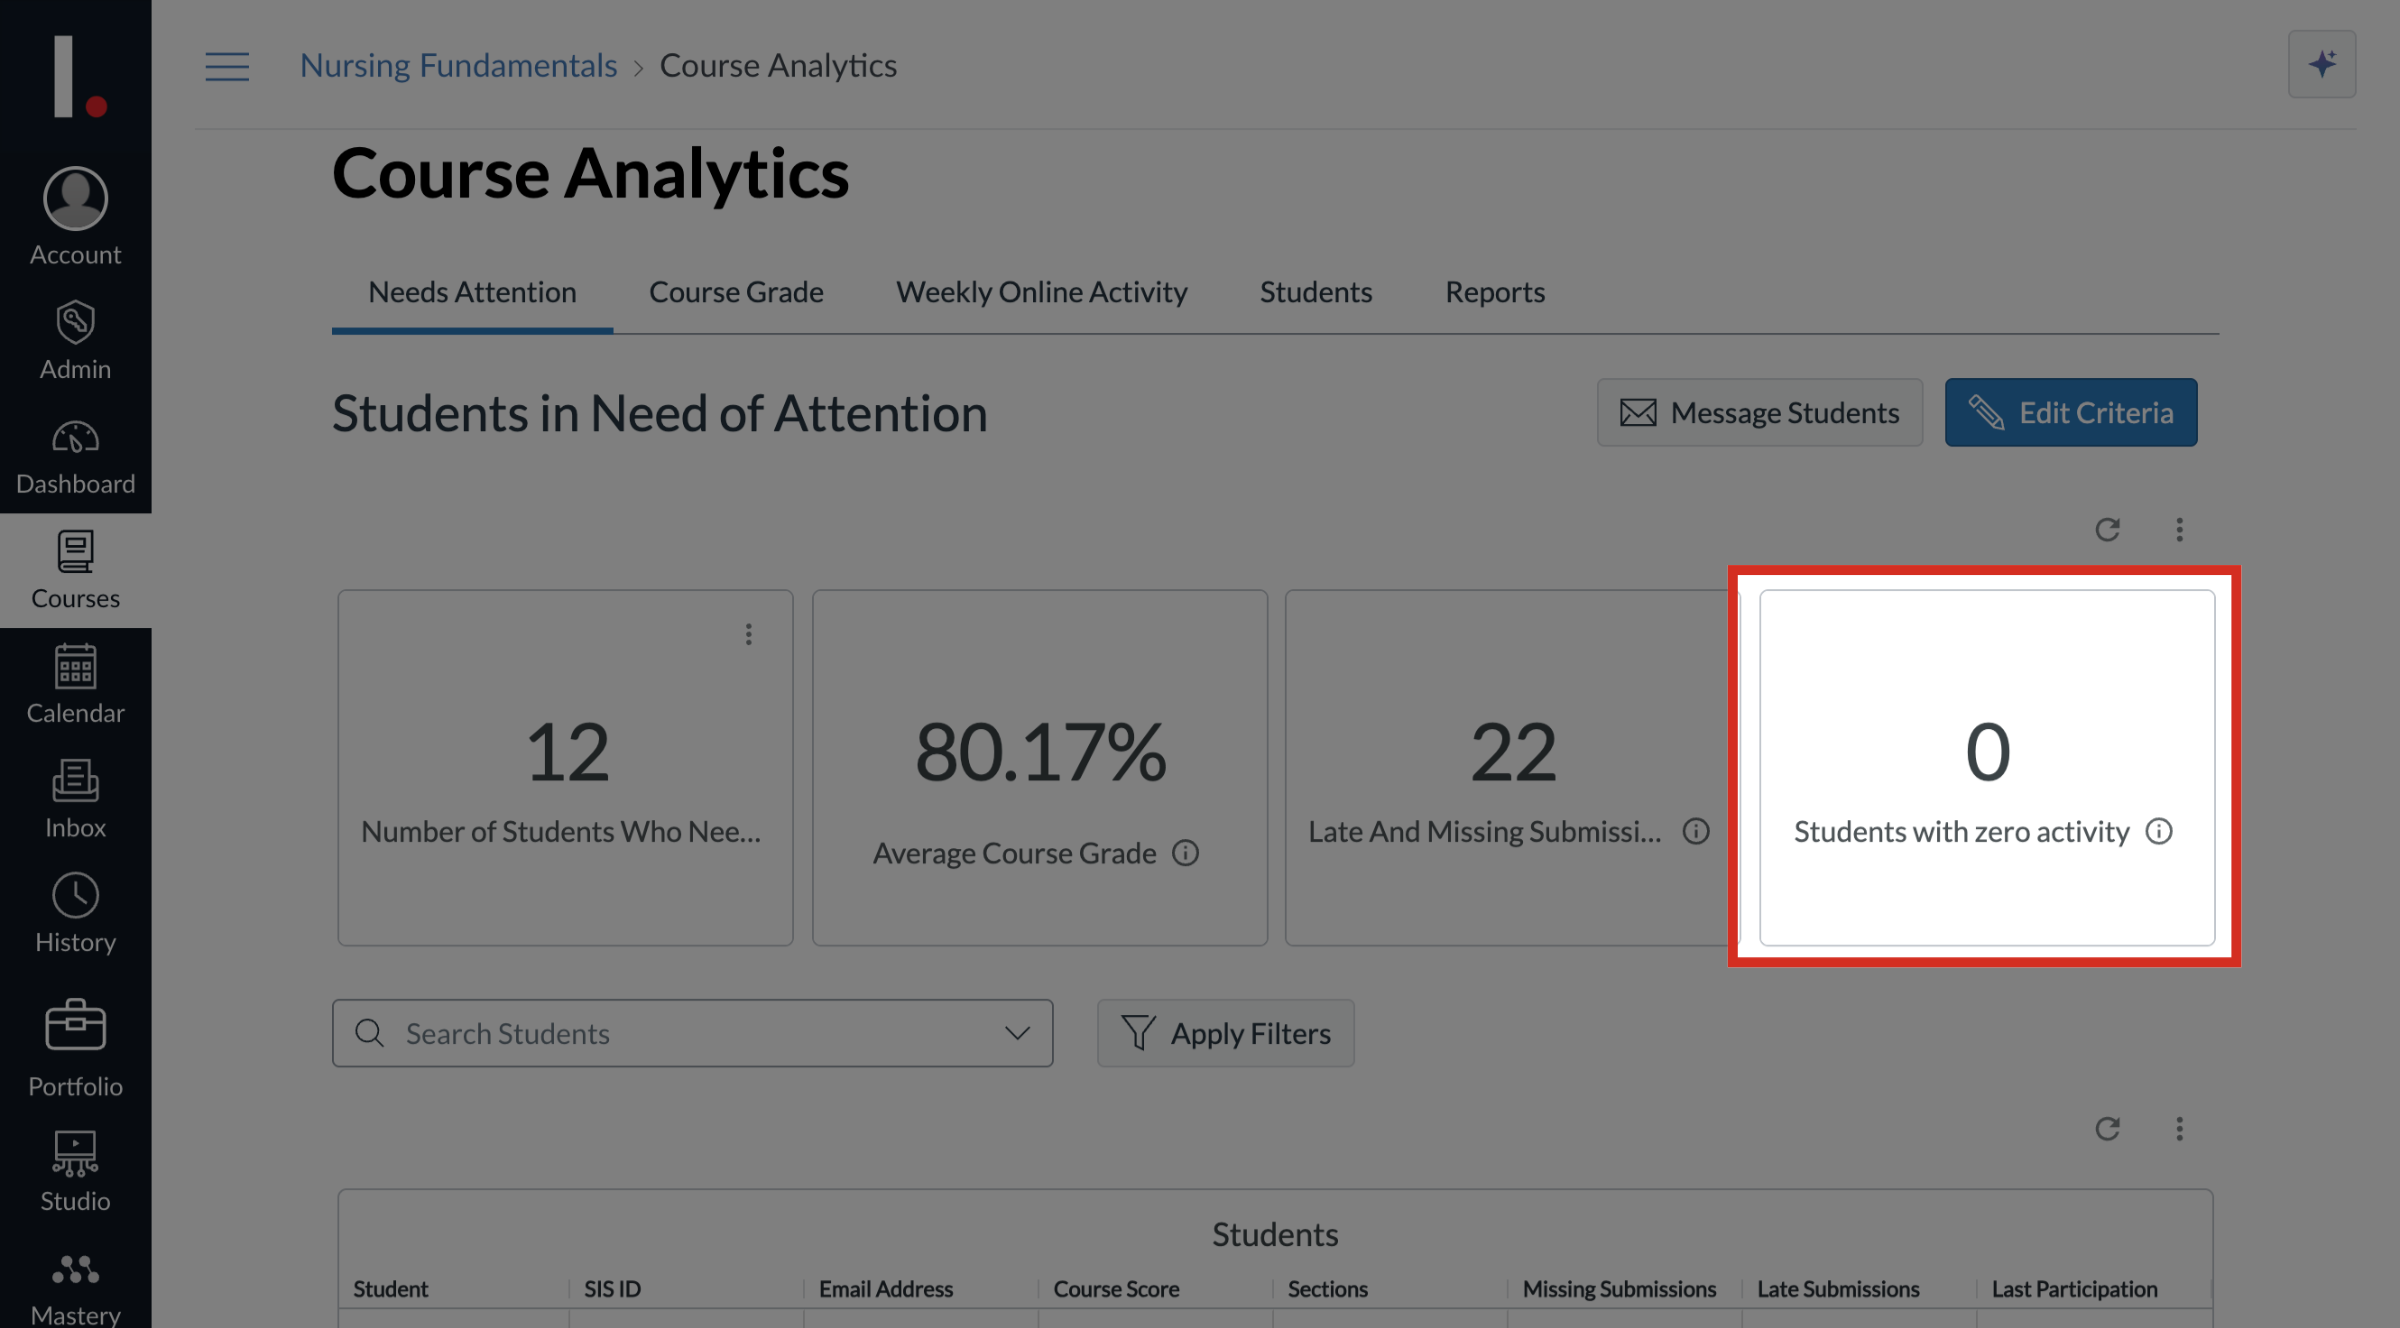
6. Students with Zero Activity
The Students with Zero Activity tile displays the students in need of attention with zero page views or participations.
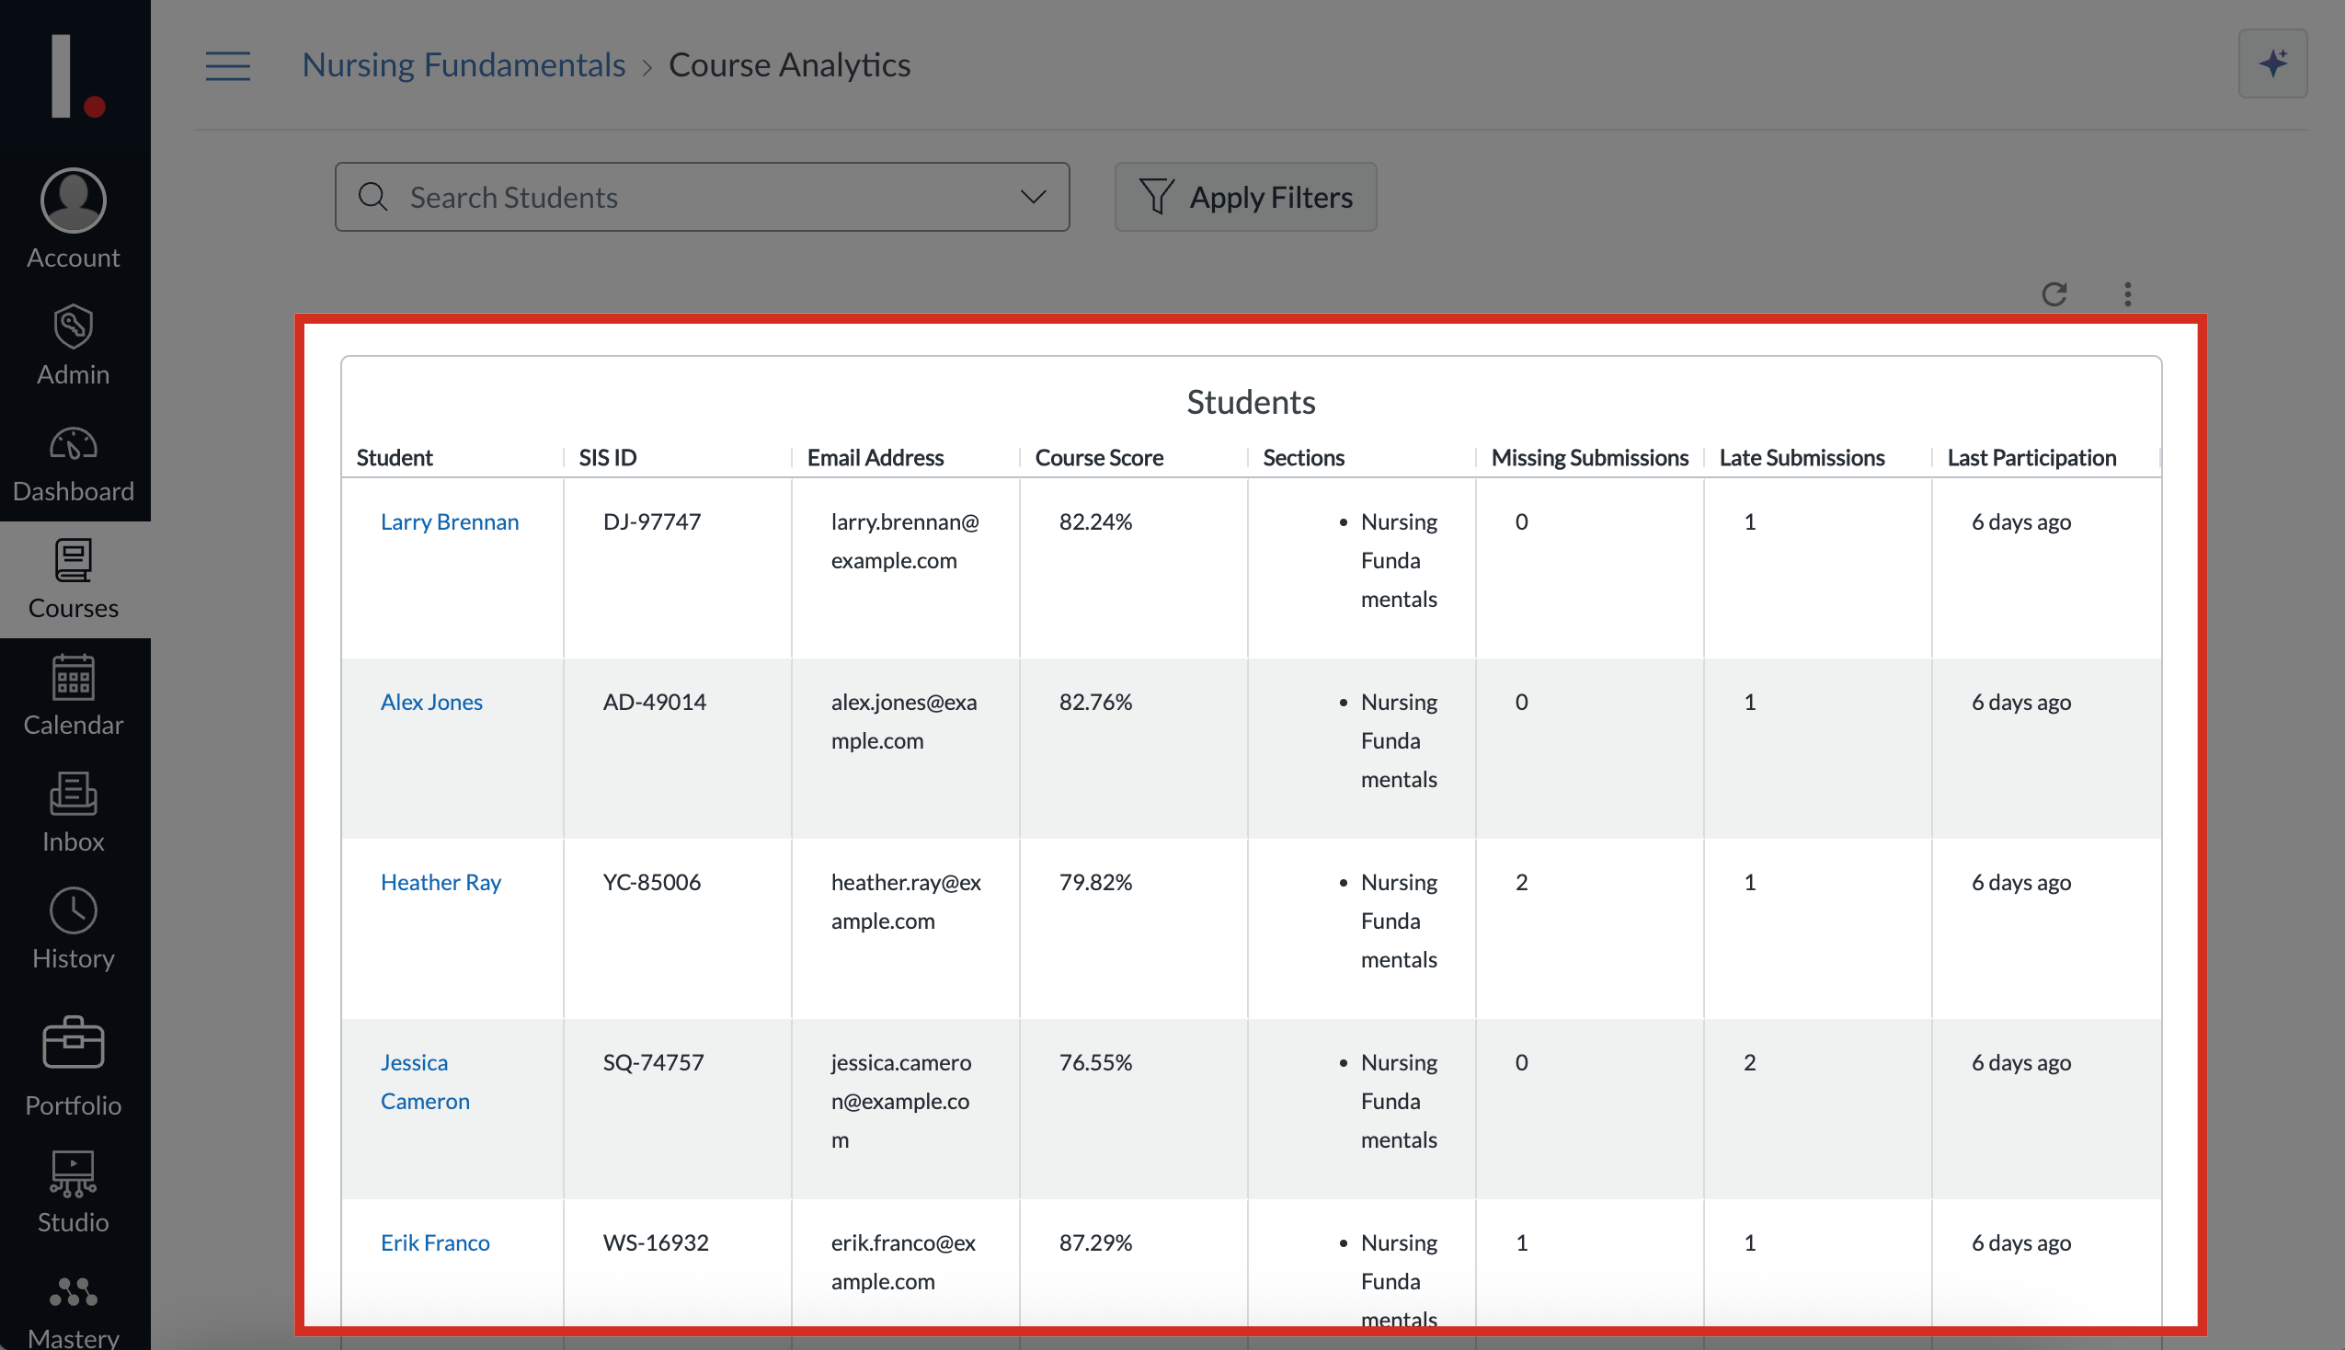
7. Students in Need of Attention
The Students table displays the students in need of attention along with their SIS ID, Email Address, Course Score, Sections, Missing Submissions, Late Submissions, and Last Participation.
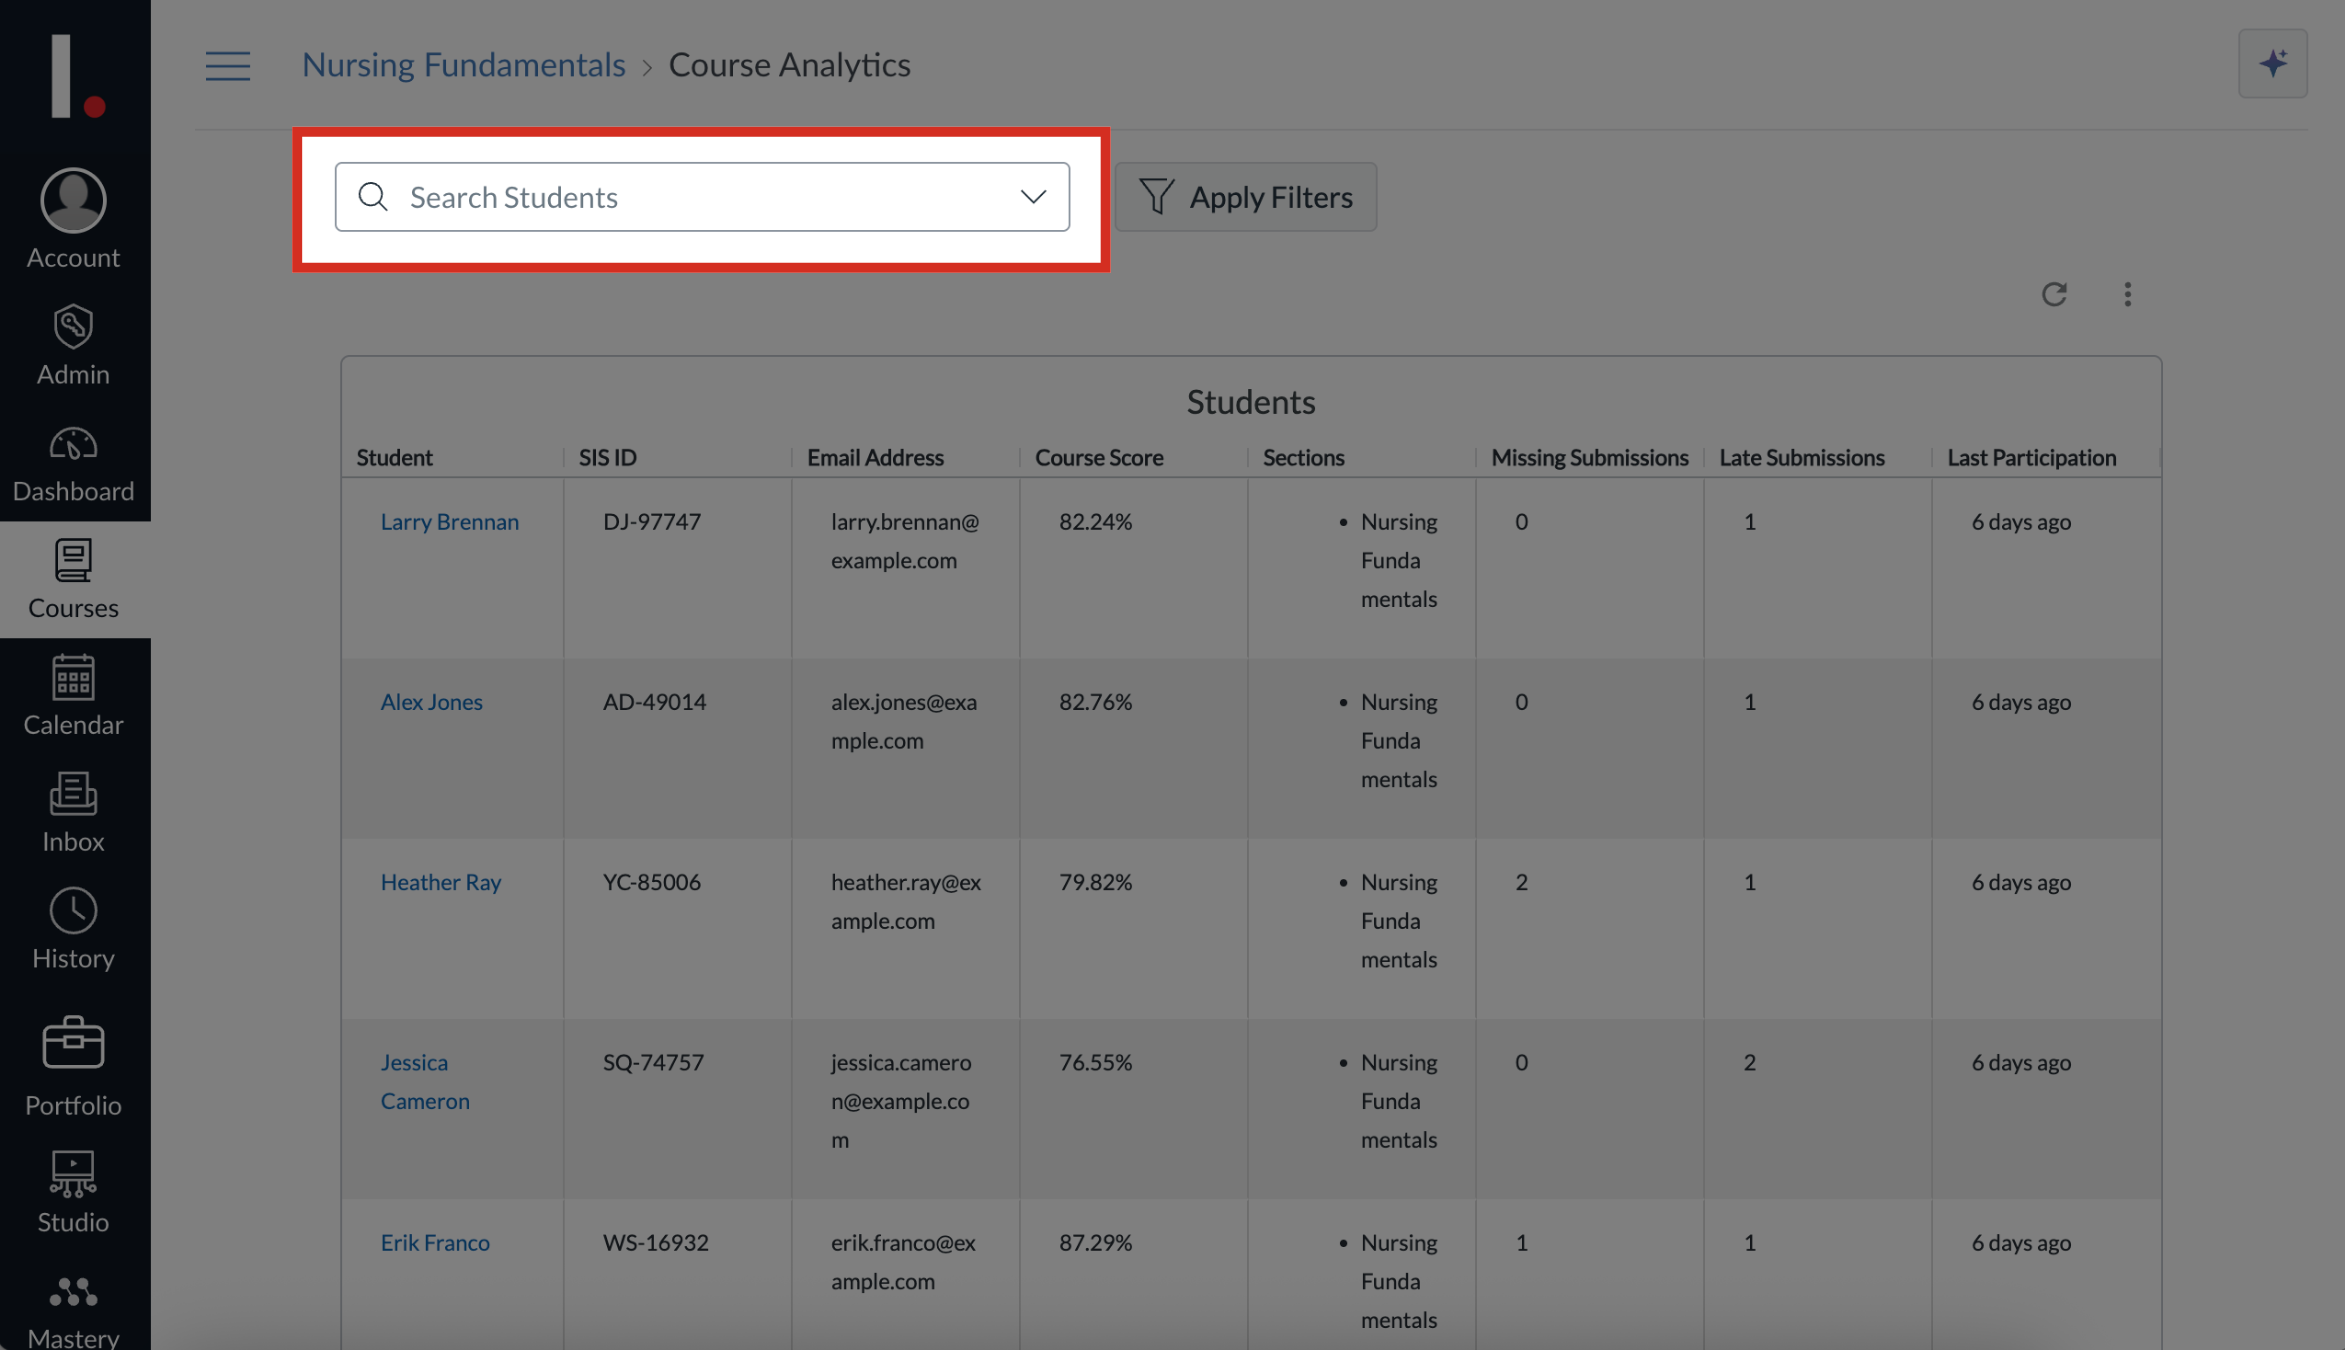
8. Search Students
To search for individual students, click the Search Students field.
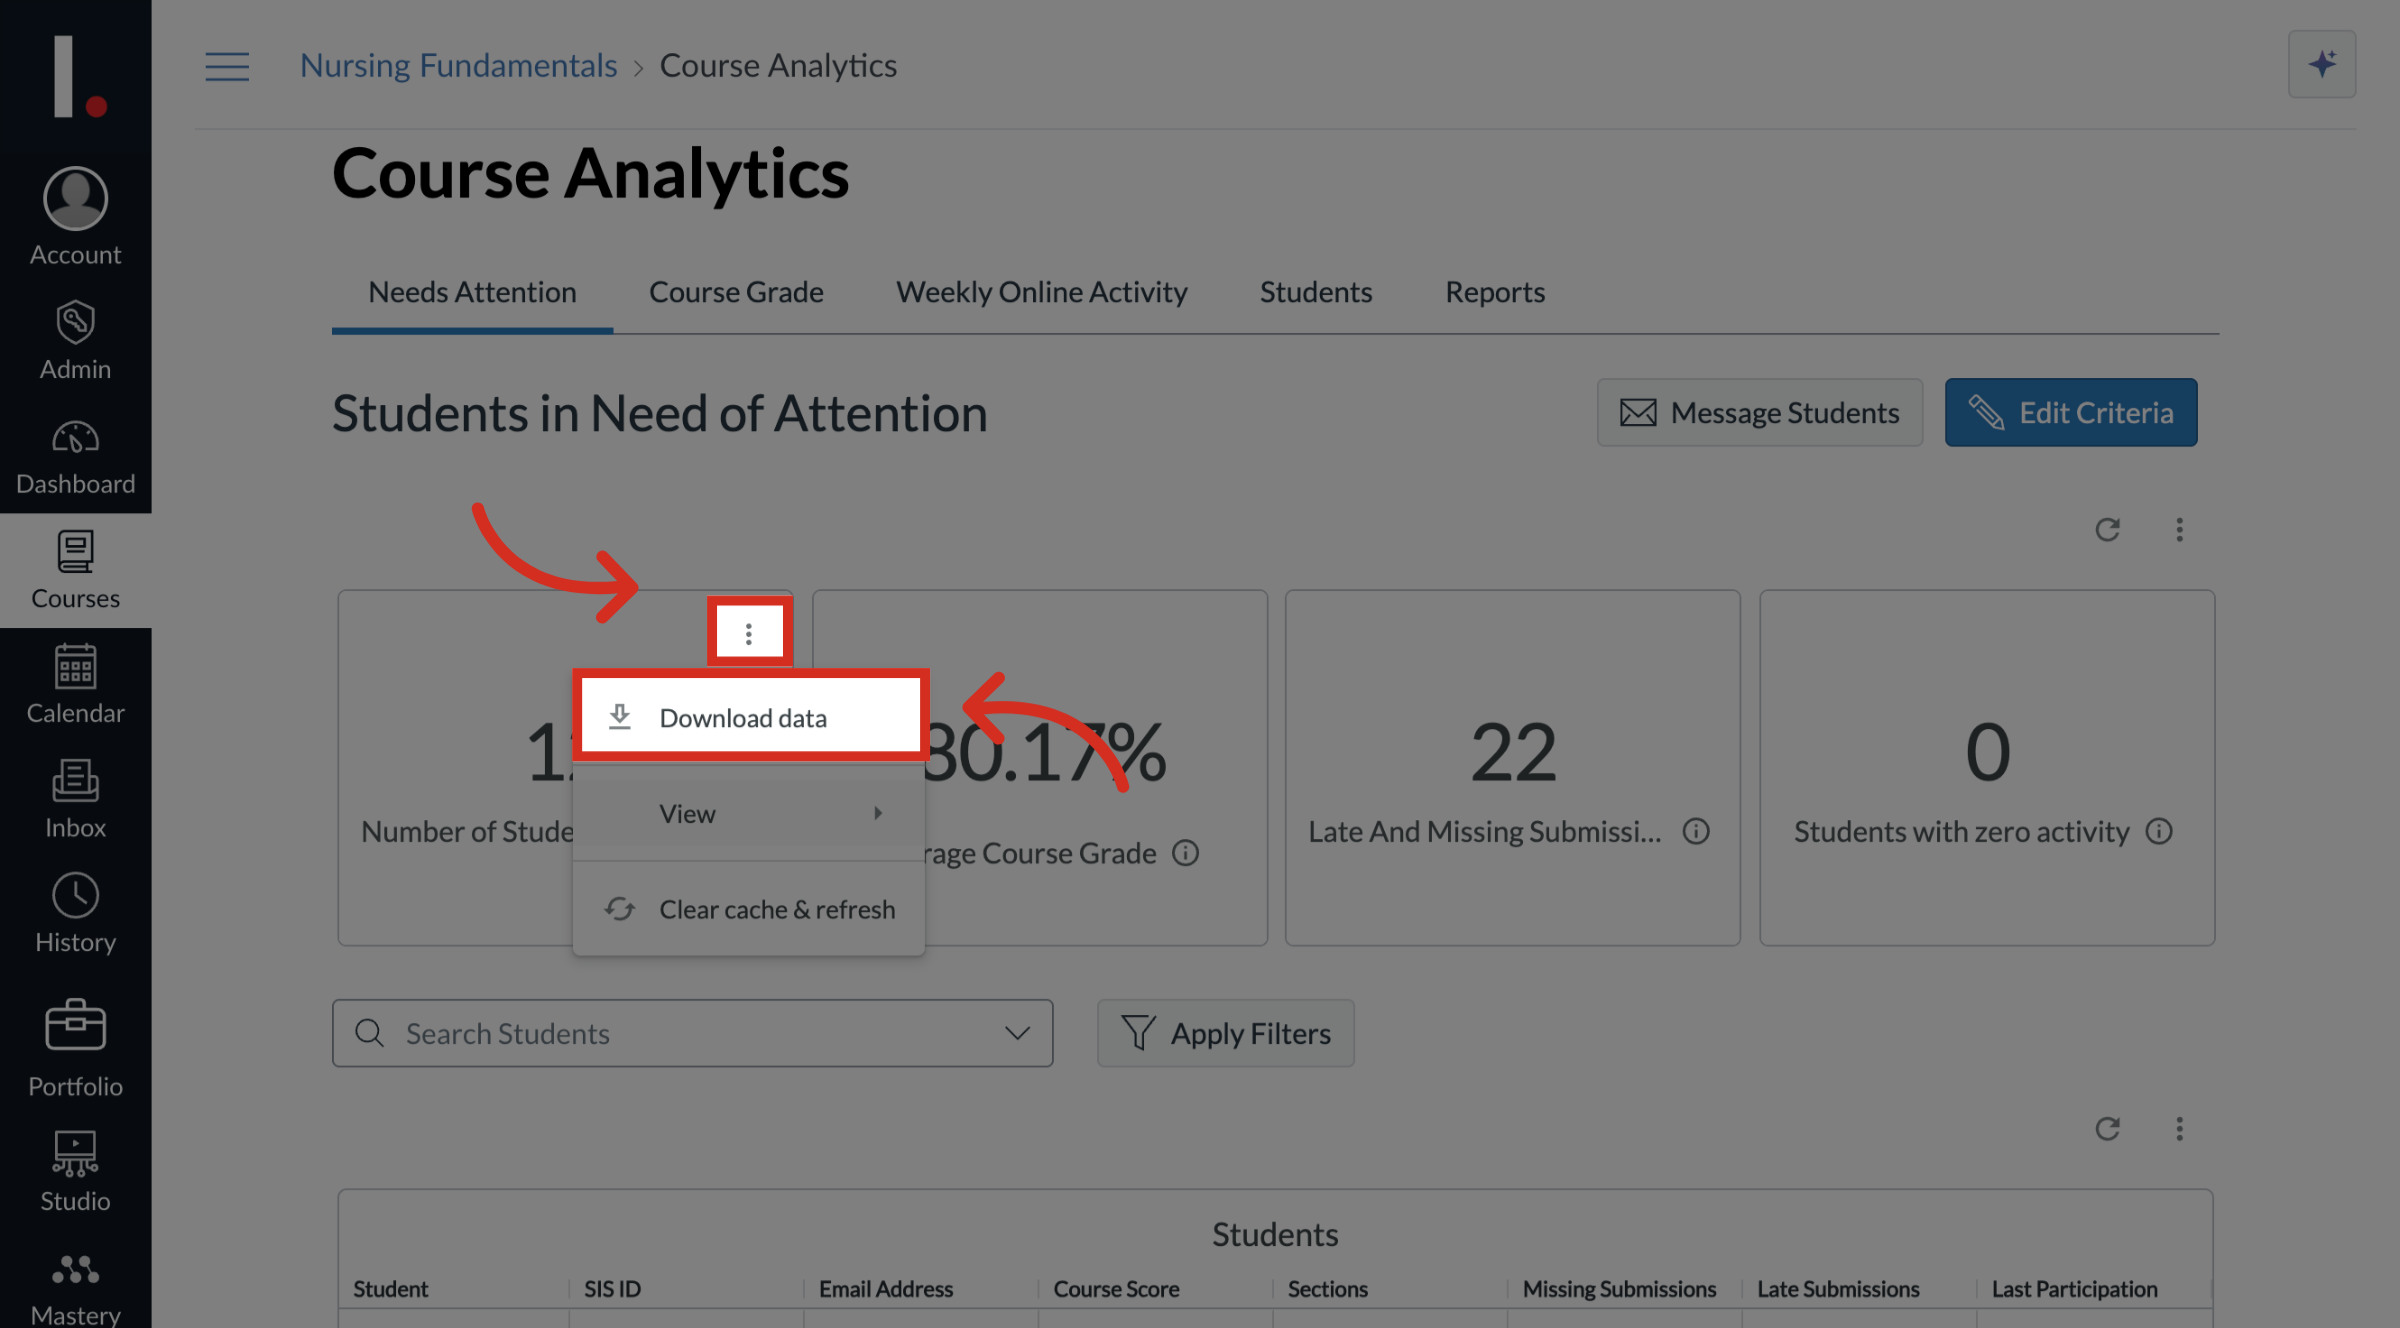
9. Open Download Data
To download tile data, click the Option icon. Then click the Download Data link.
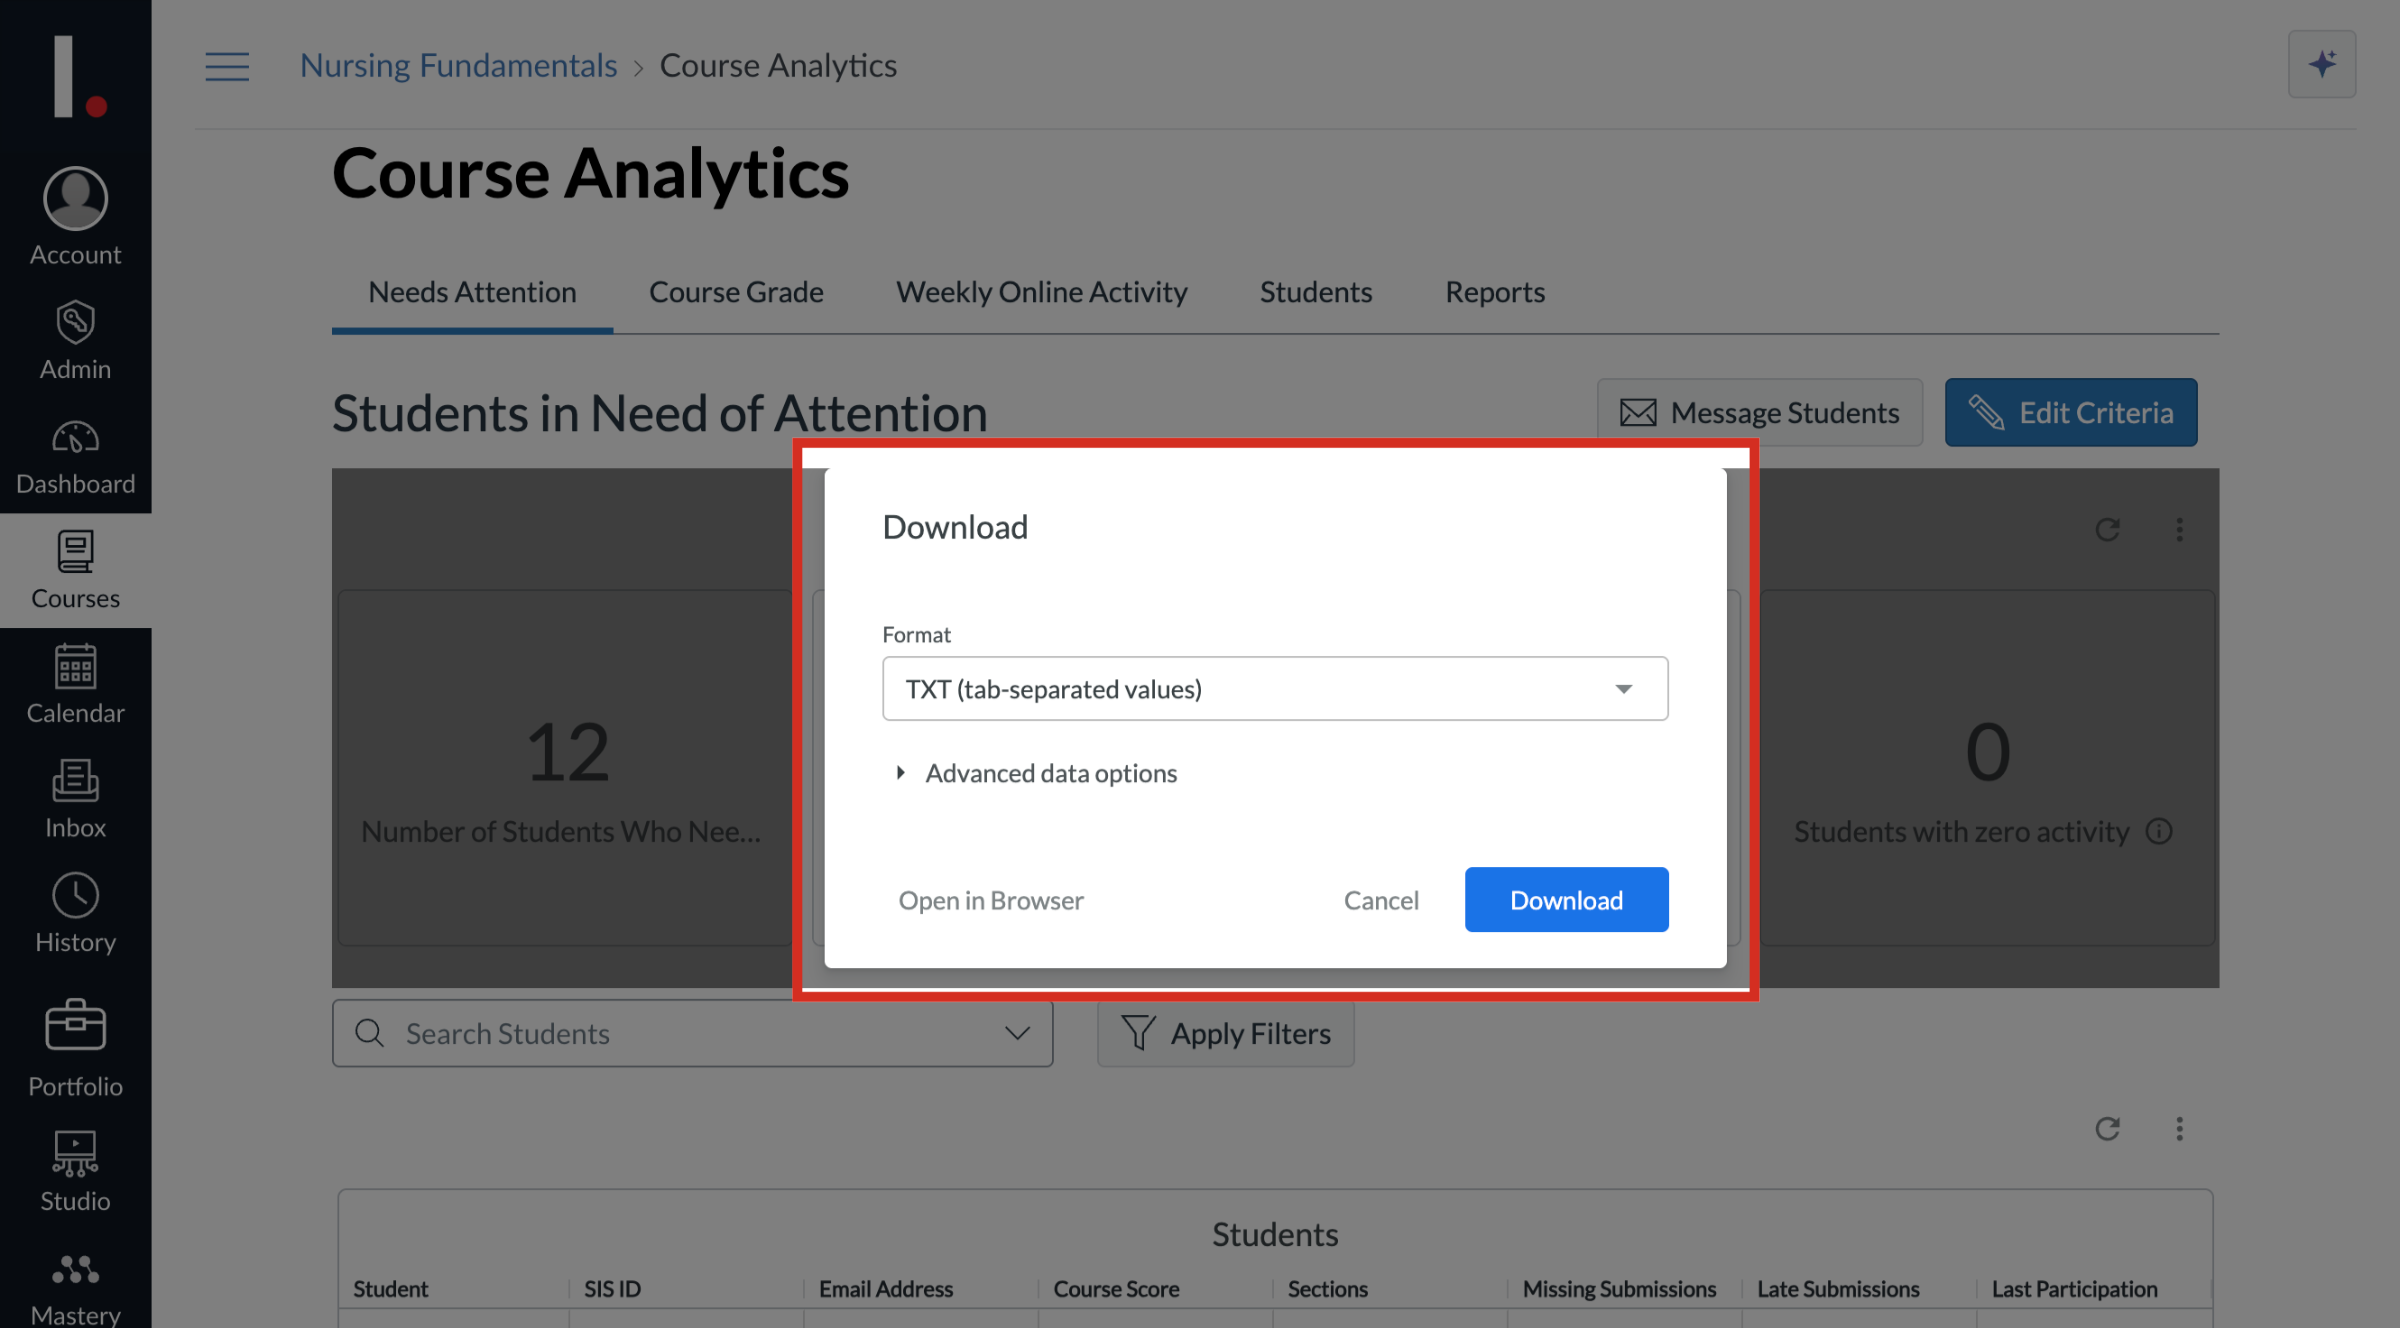
10. View Download Options
The download options displays in the Download modal.
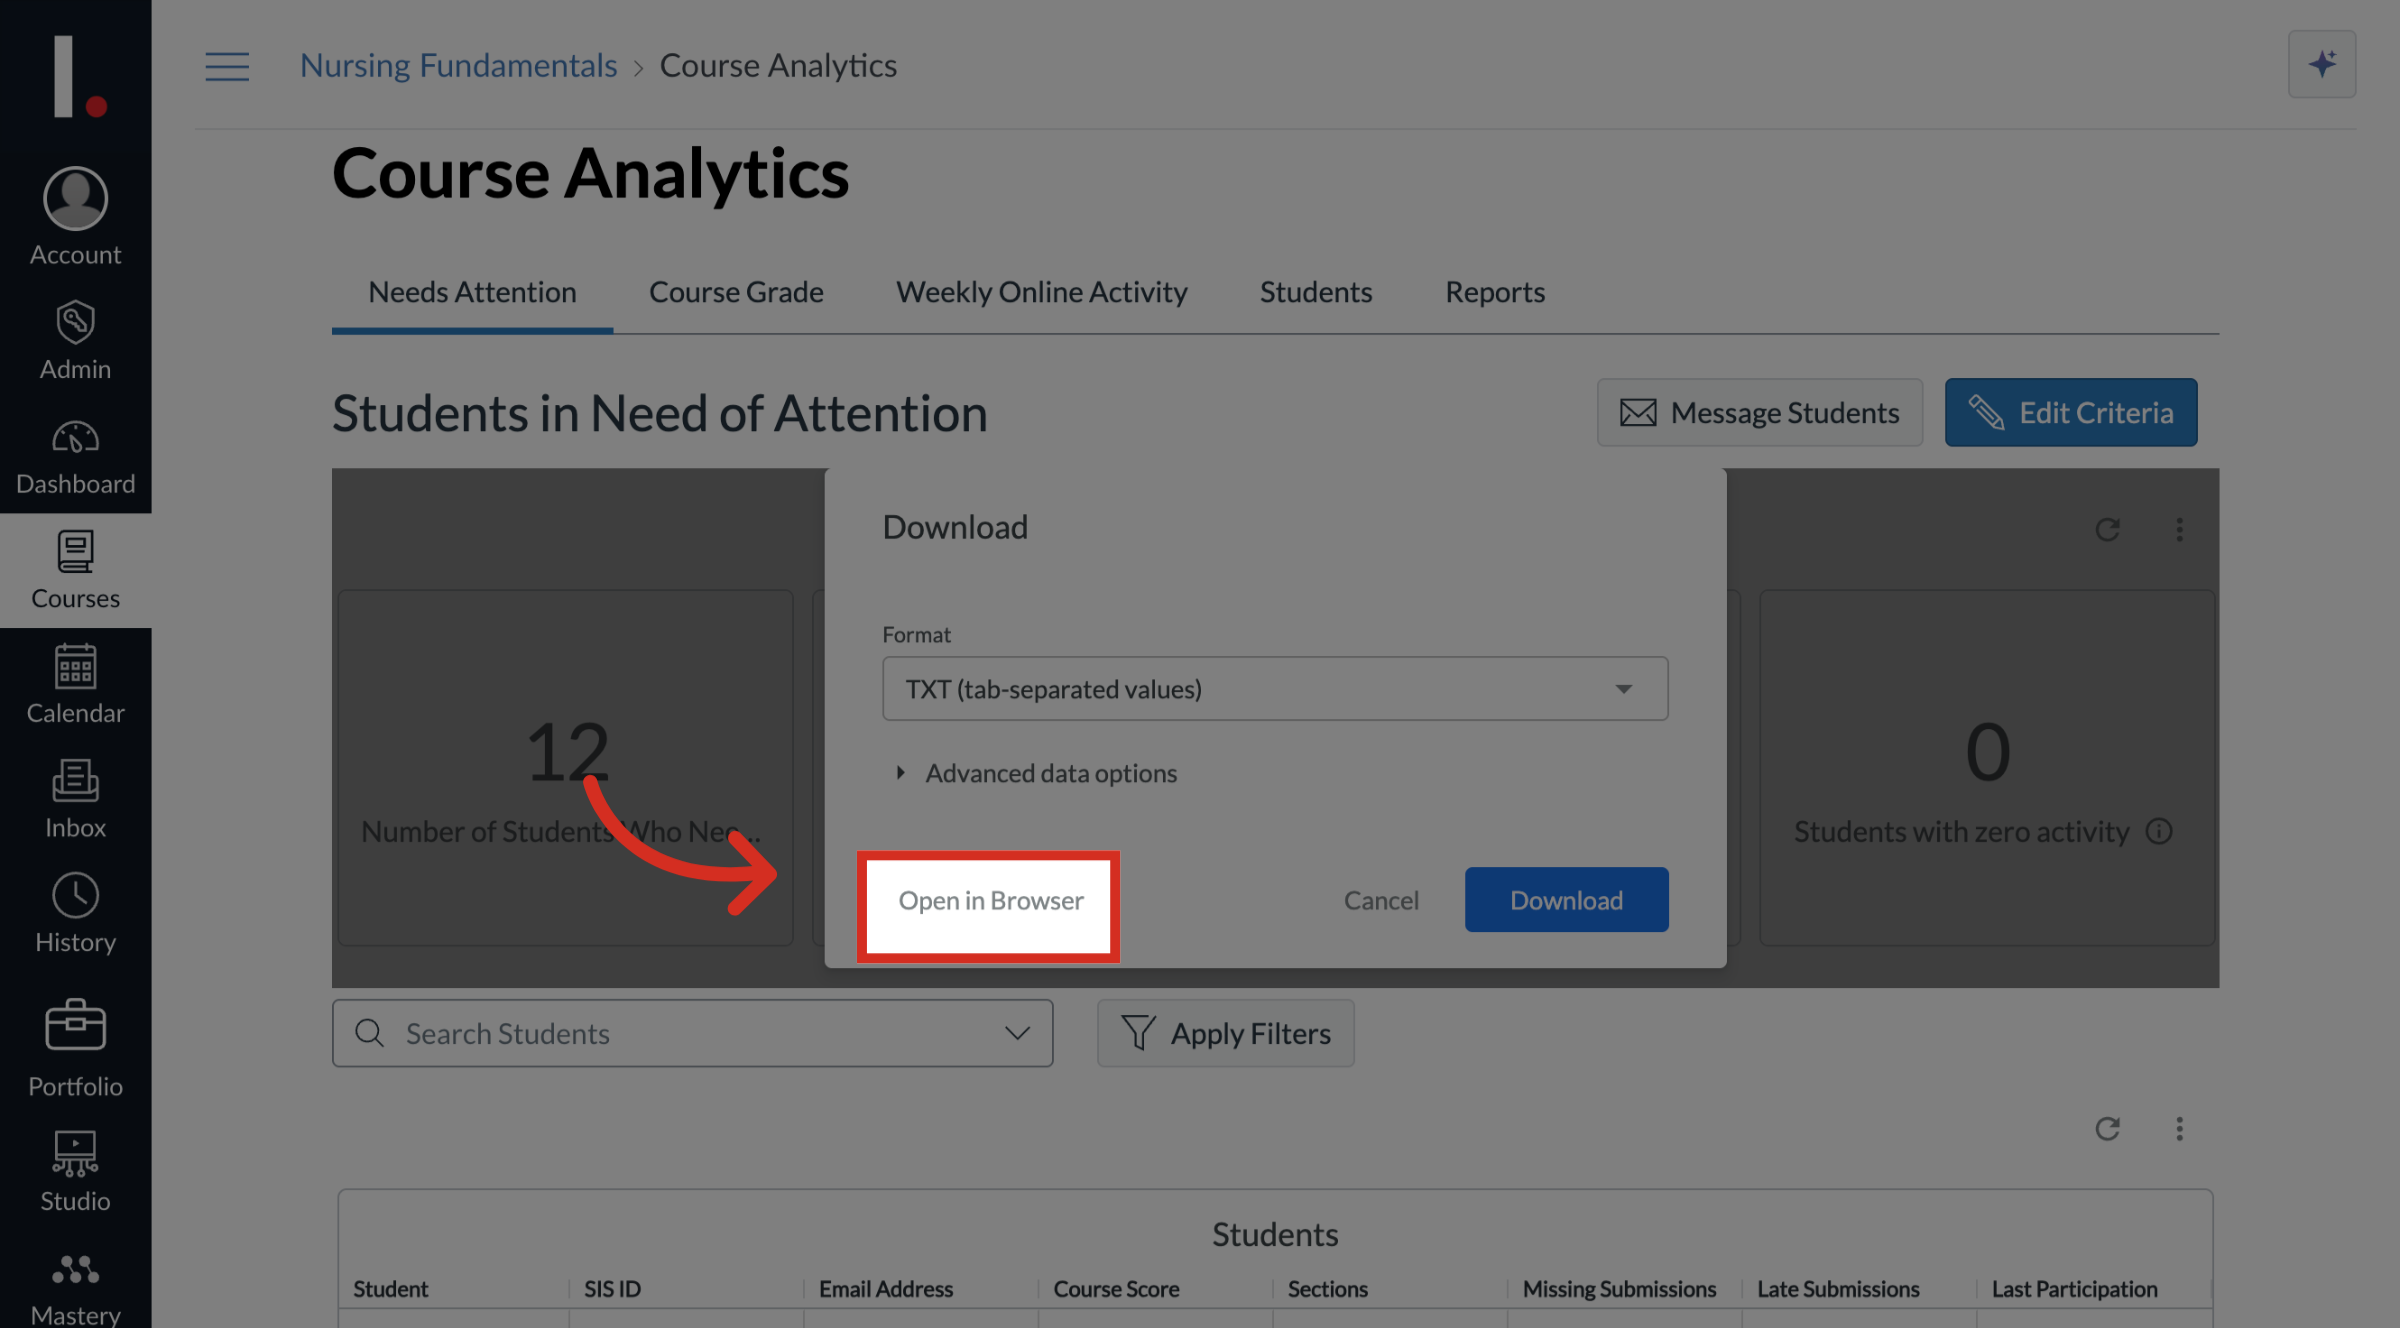
11. Open in Browser
To view download in the browser, click the Open in Browser link.
12. Select Format
To change the format, click the Format dropdown menu.
You can choose the following format options:
TXT (tab-separated values)
Excel Spreadsheet (Excel 2007 or later)
CSV
JSON

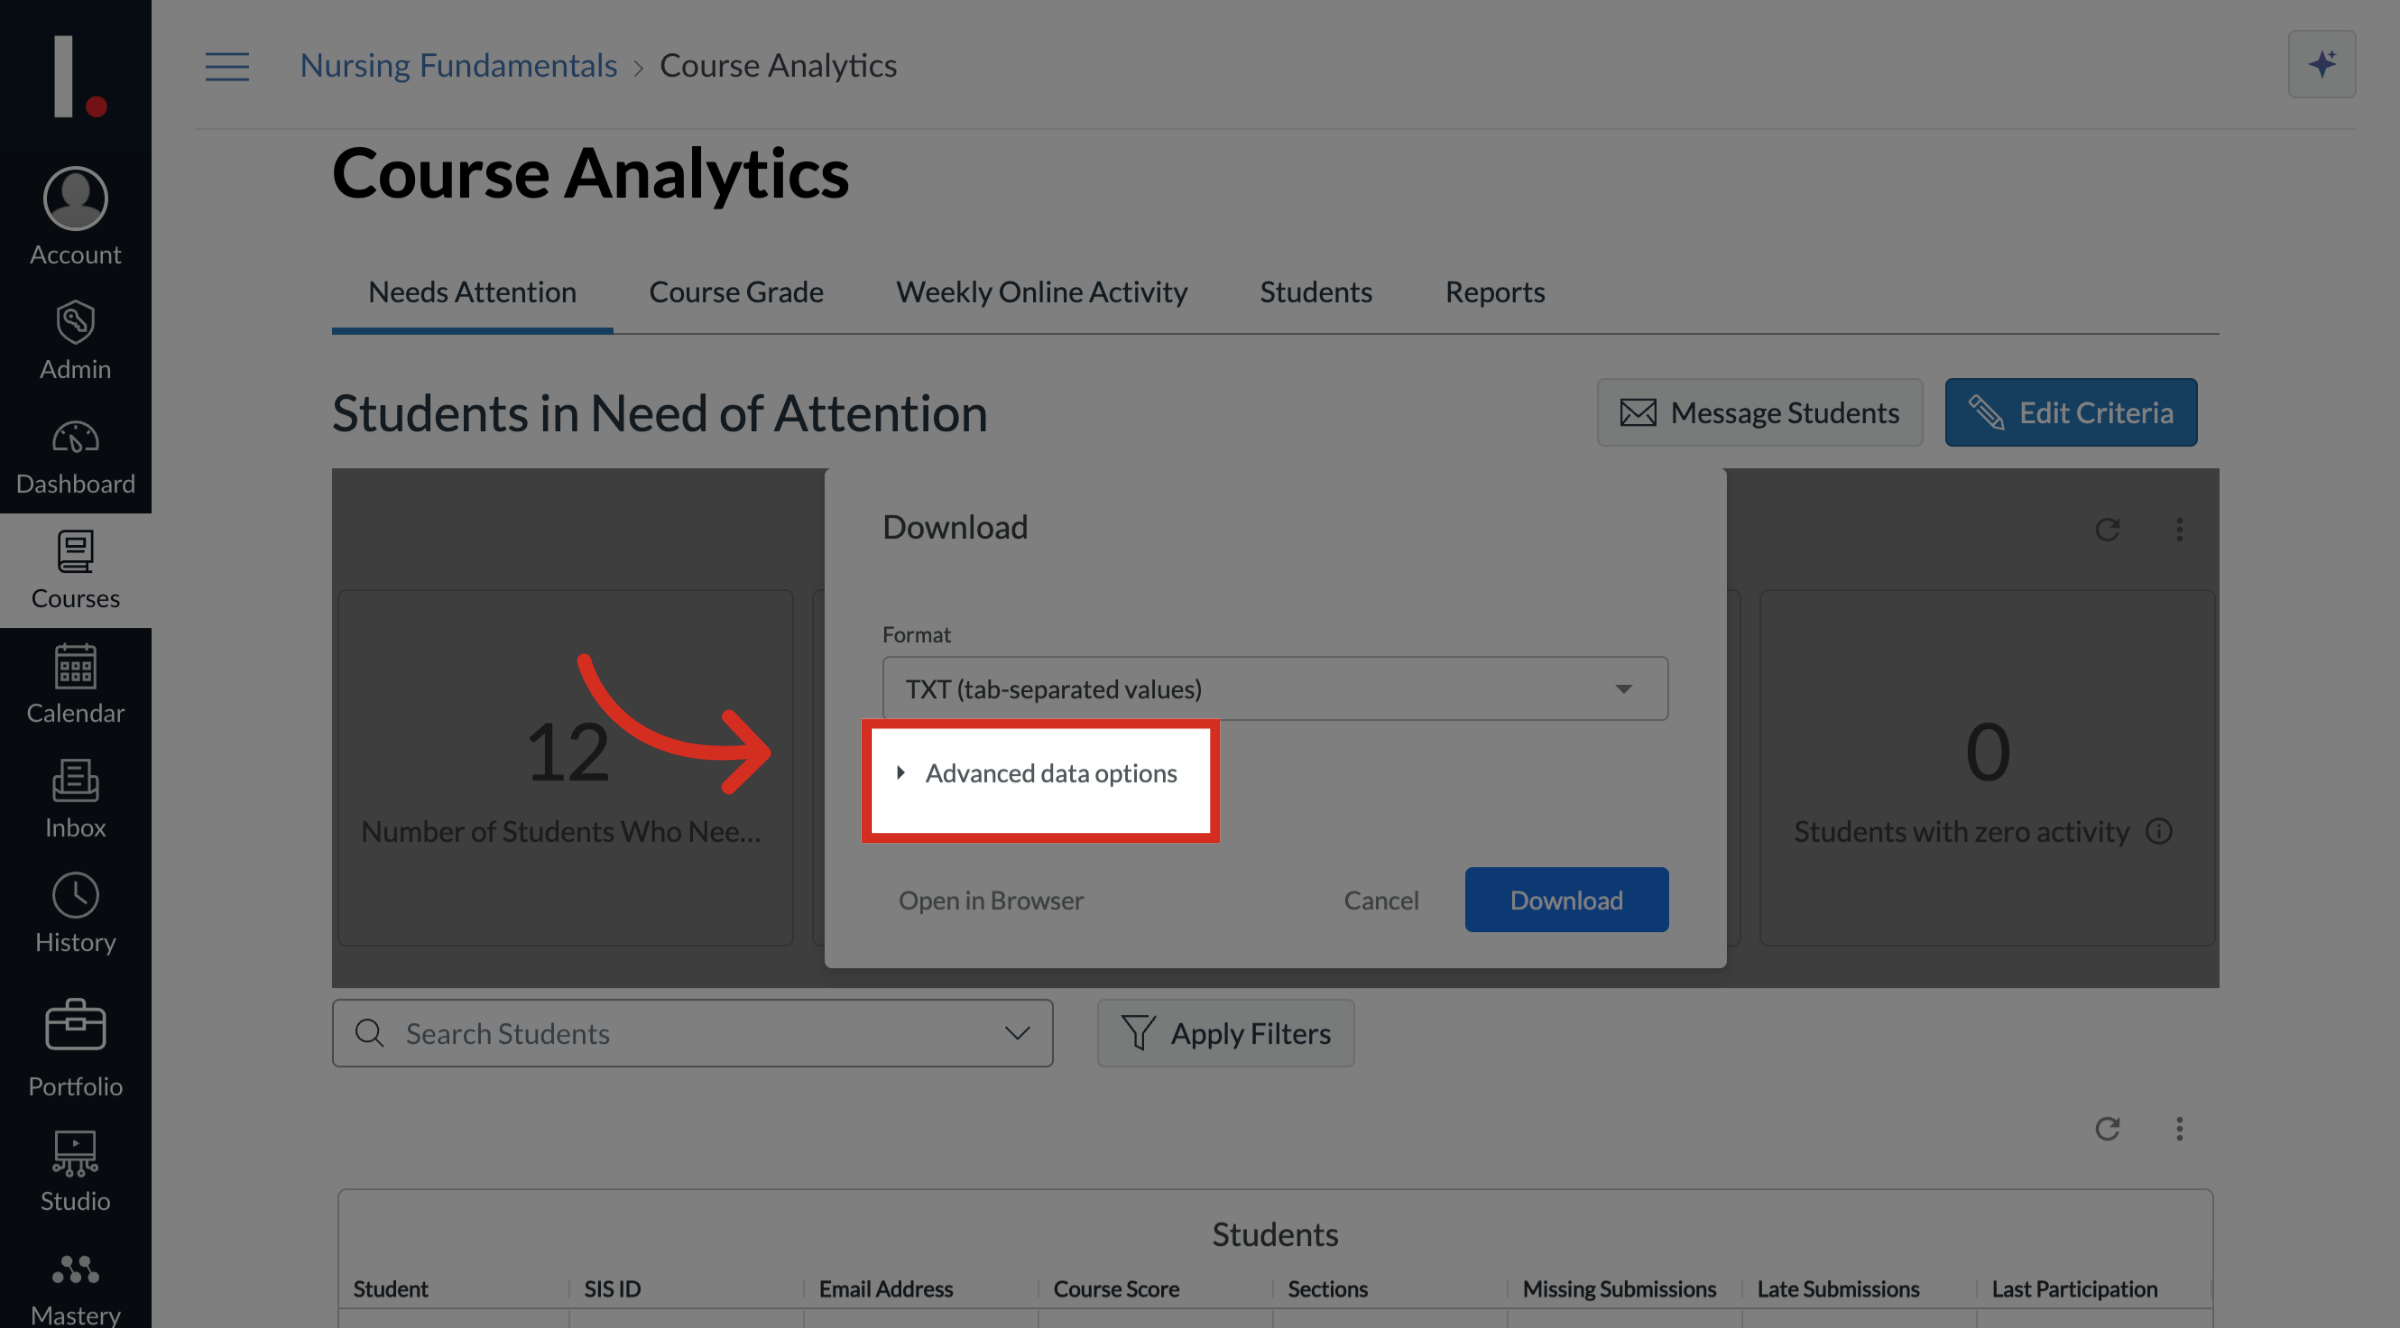
13. Open Advanced Data Options
To select advanced data options, click the Advanced Data Options dropdown menu.
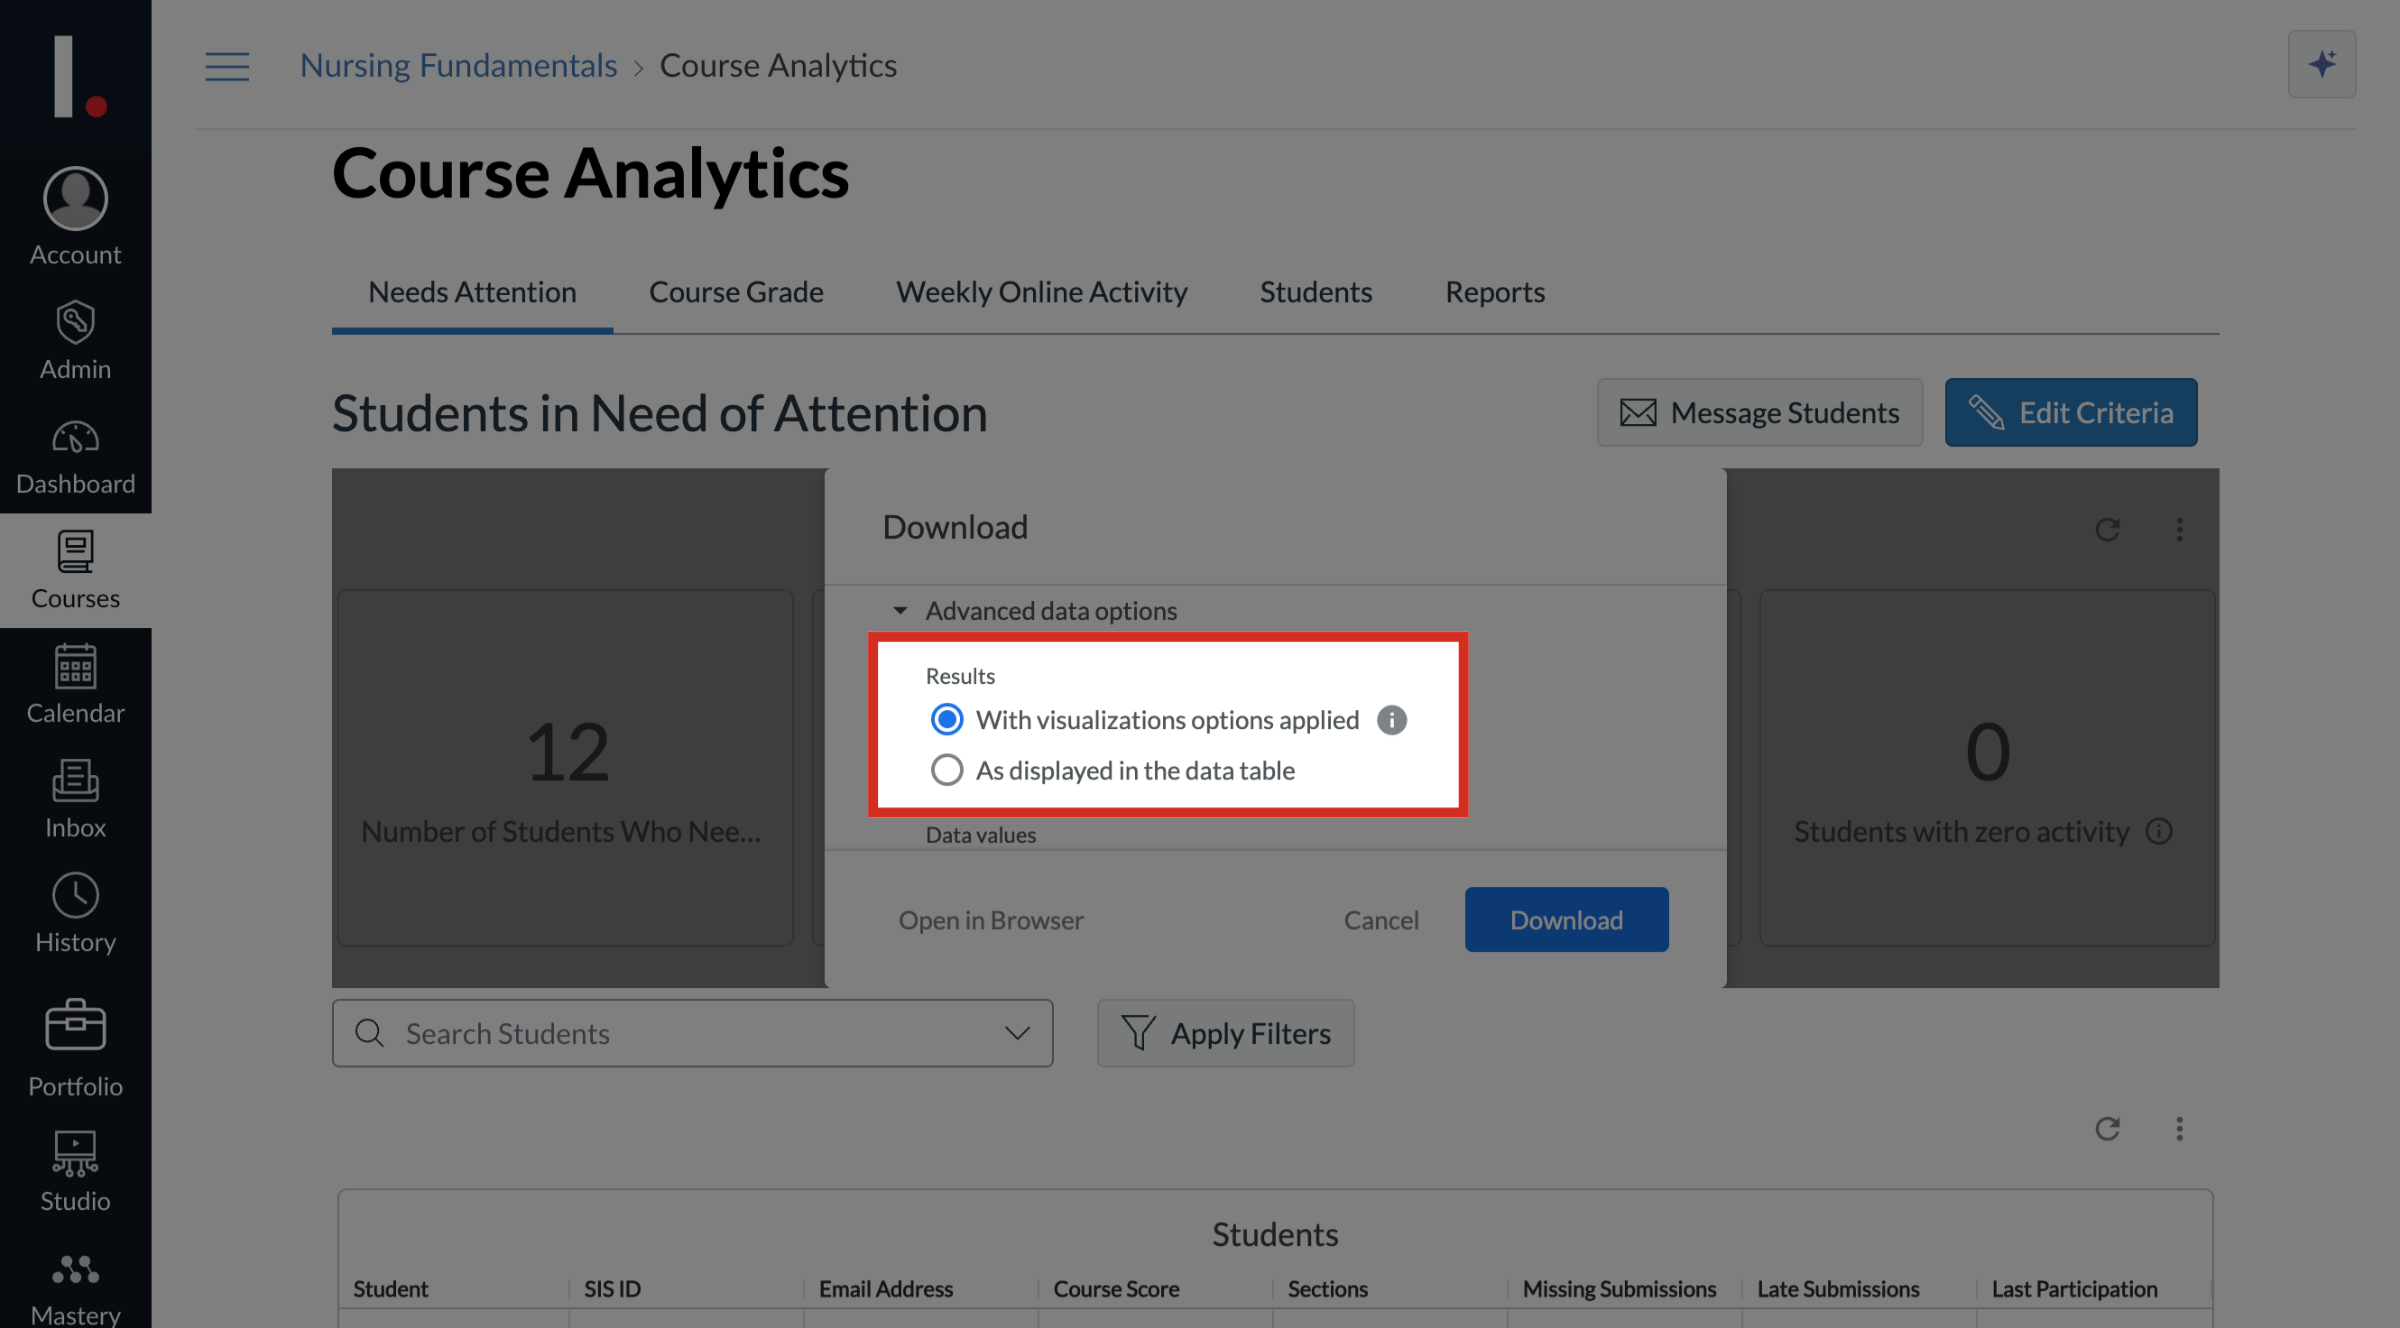
14. Select Results
The following Results options are available:
With visualizations options applied
As displayed in the data table
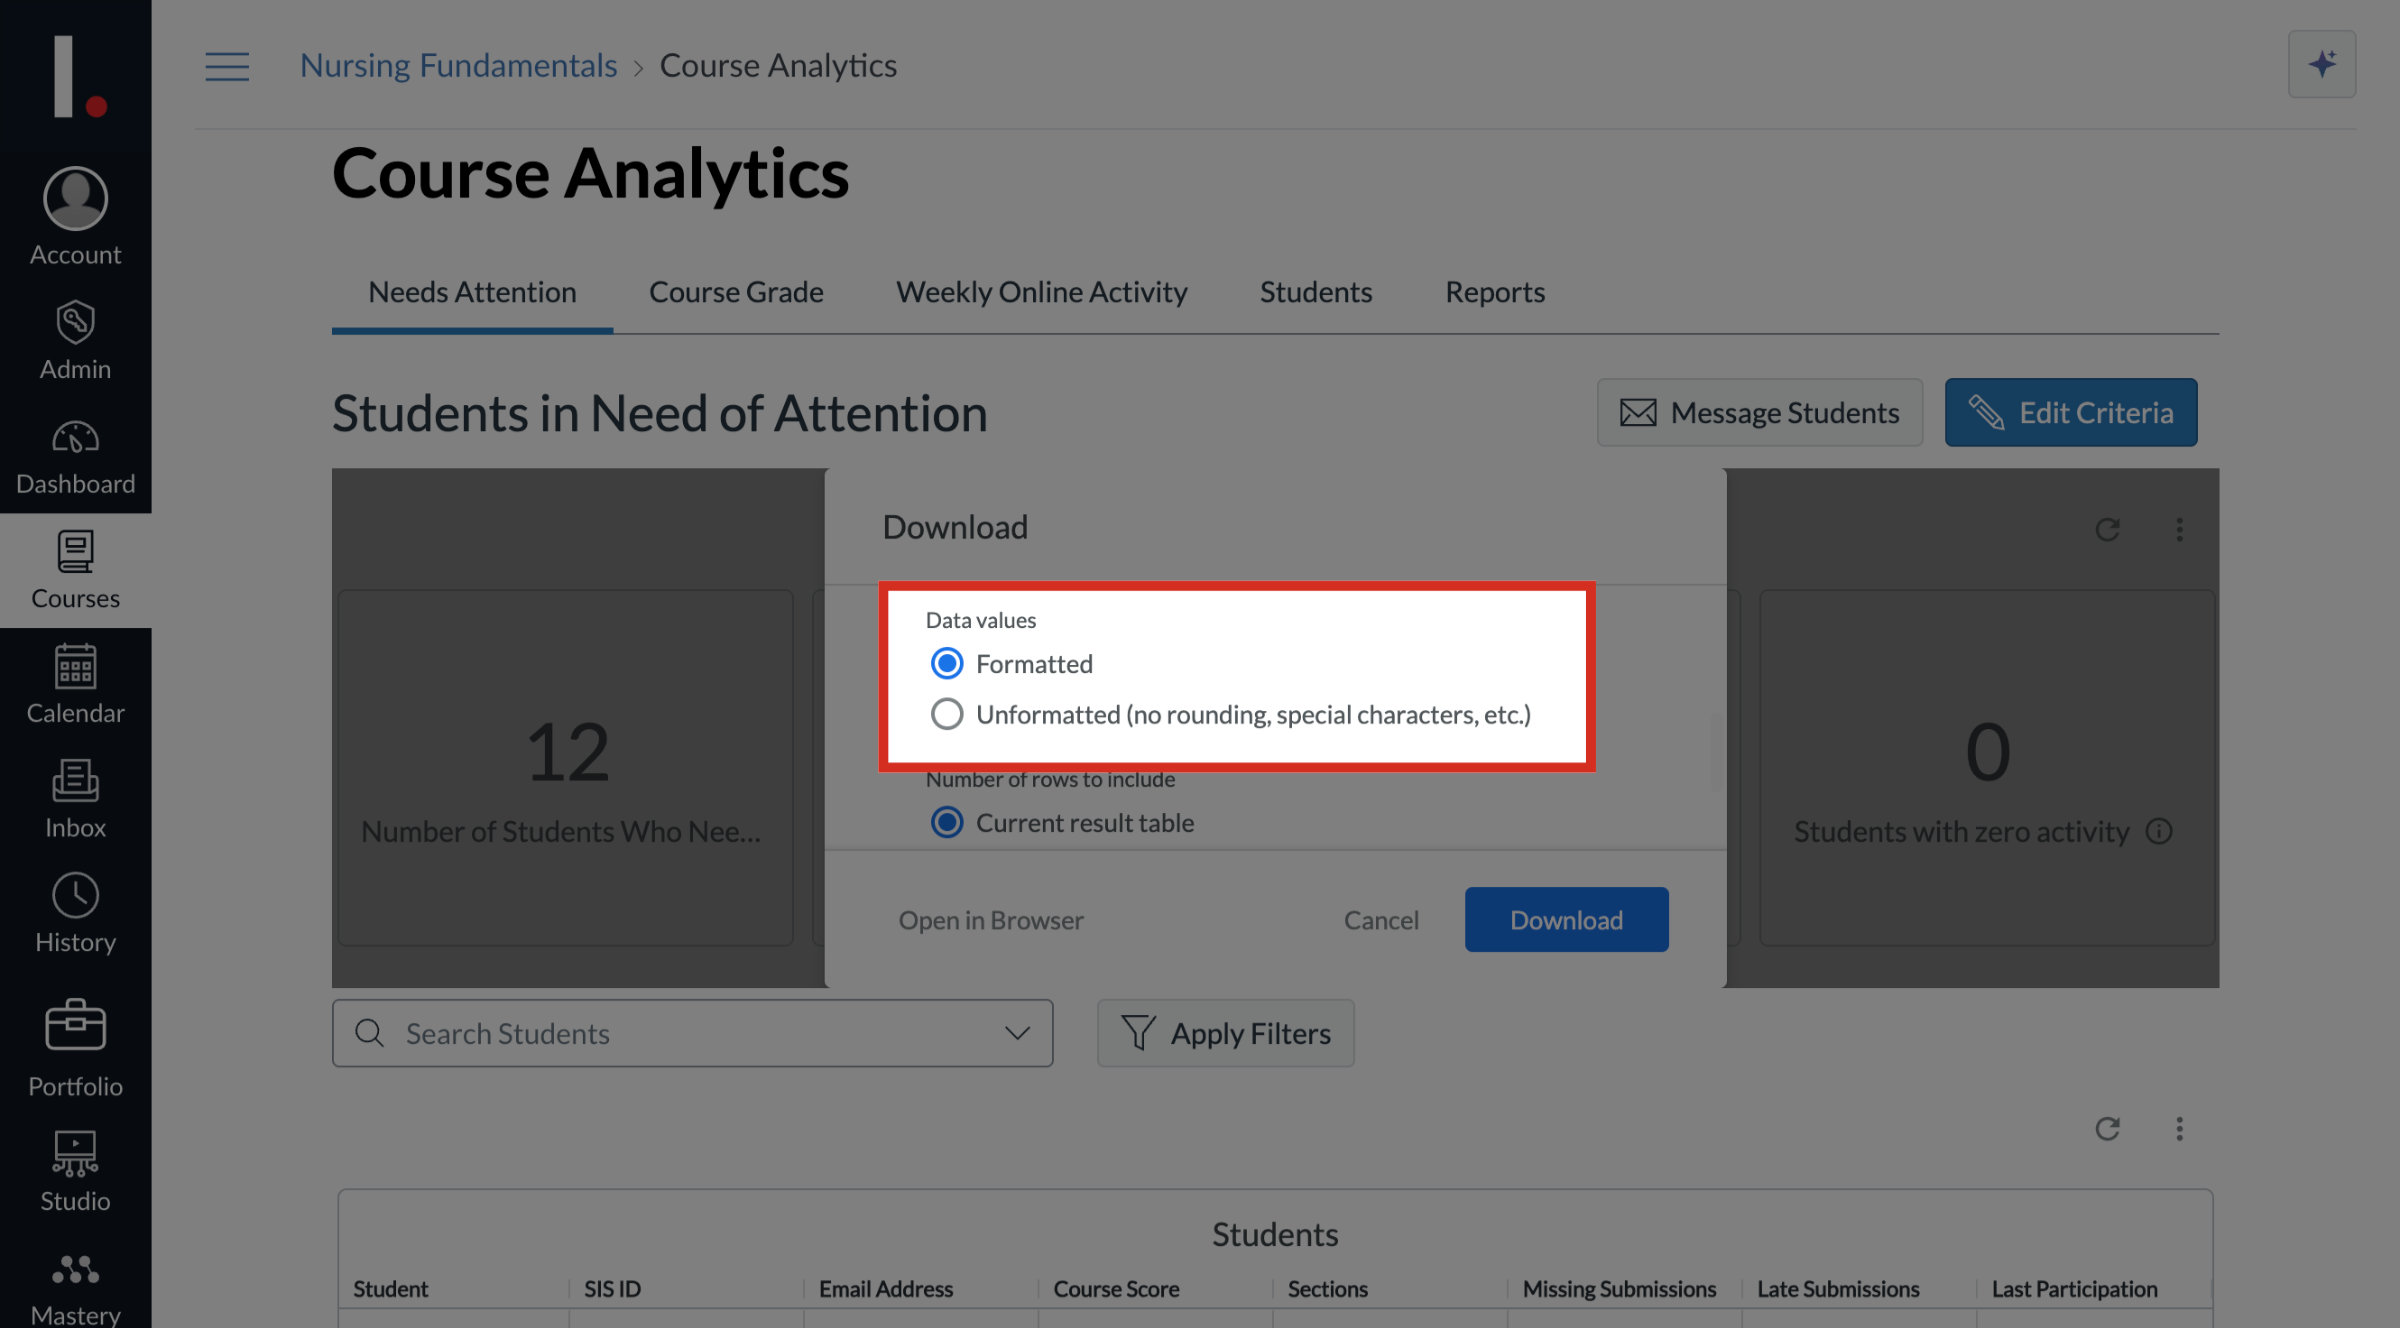
15. Select Data Values
The following Data values options are available:
Formatted
Unformatted
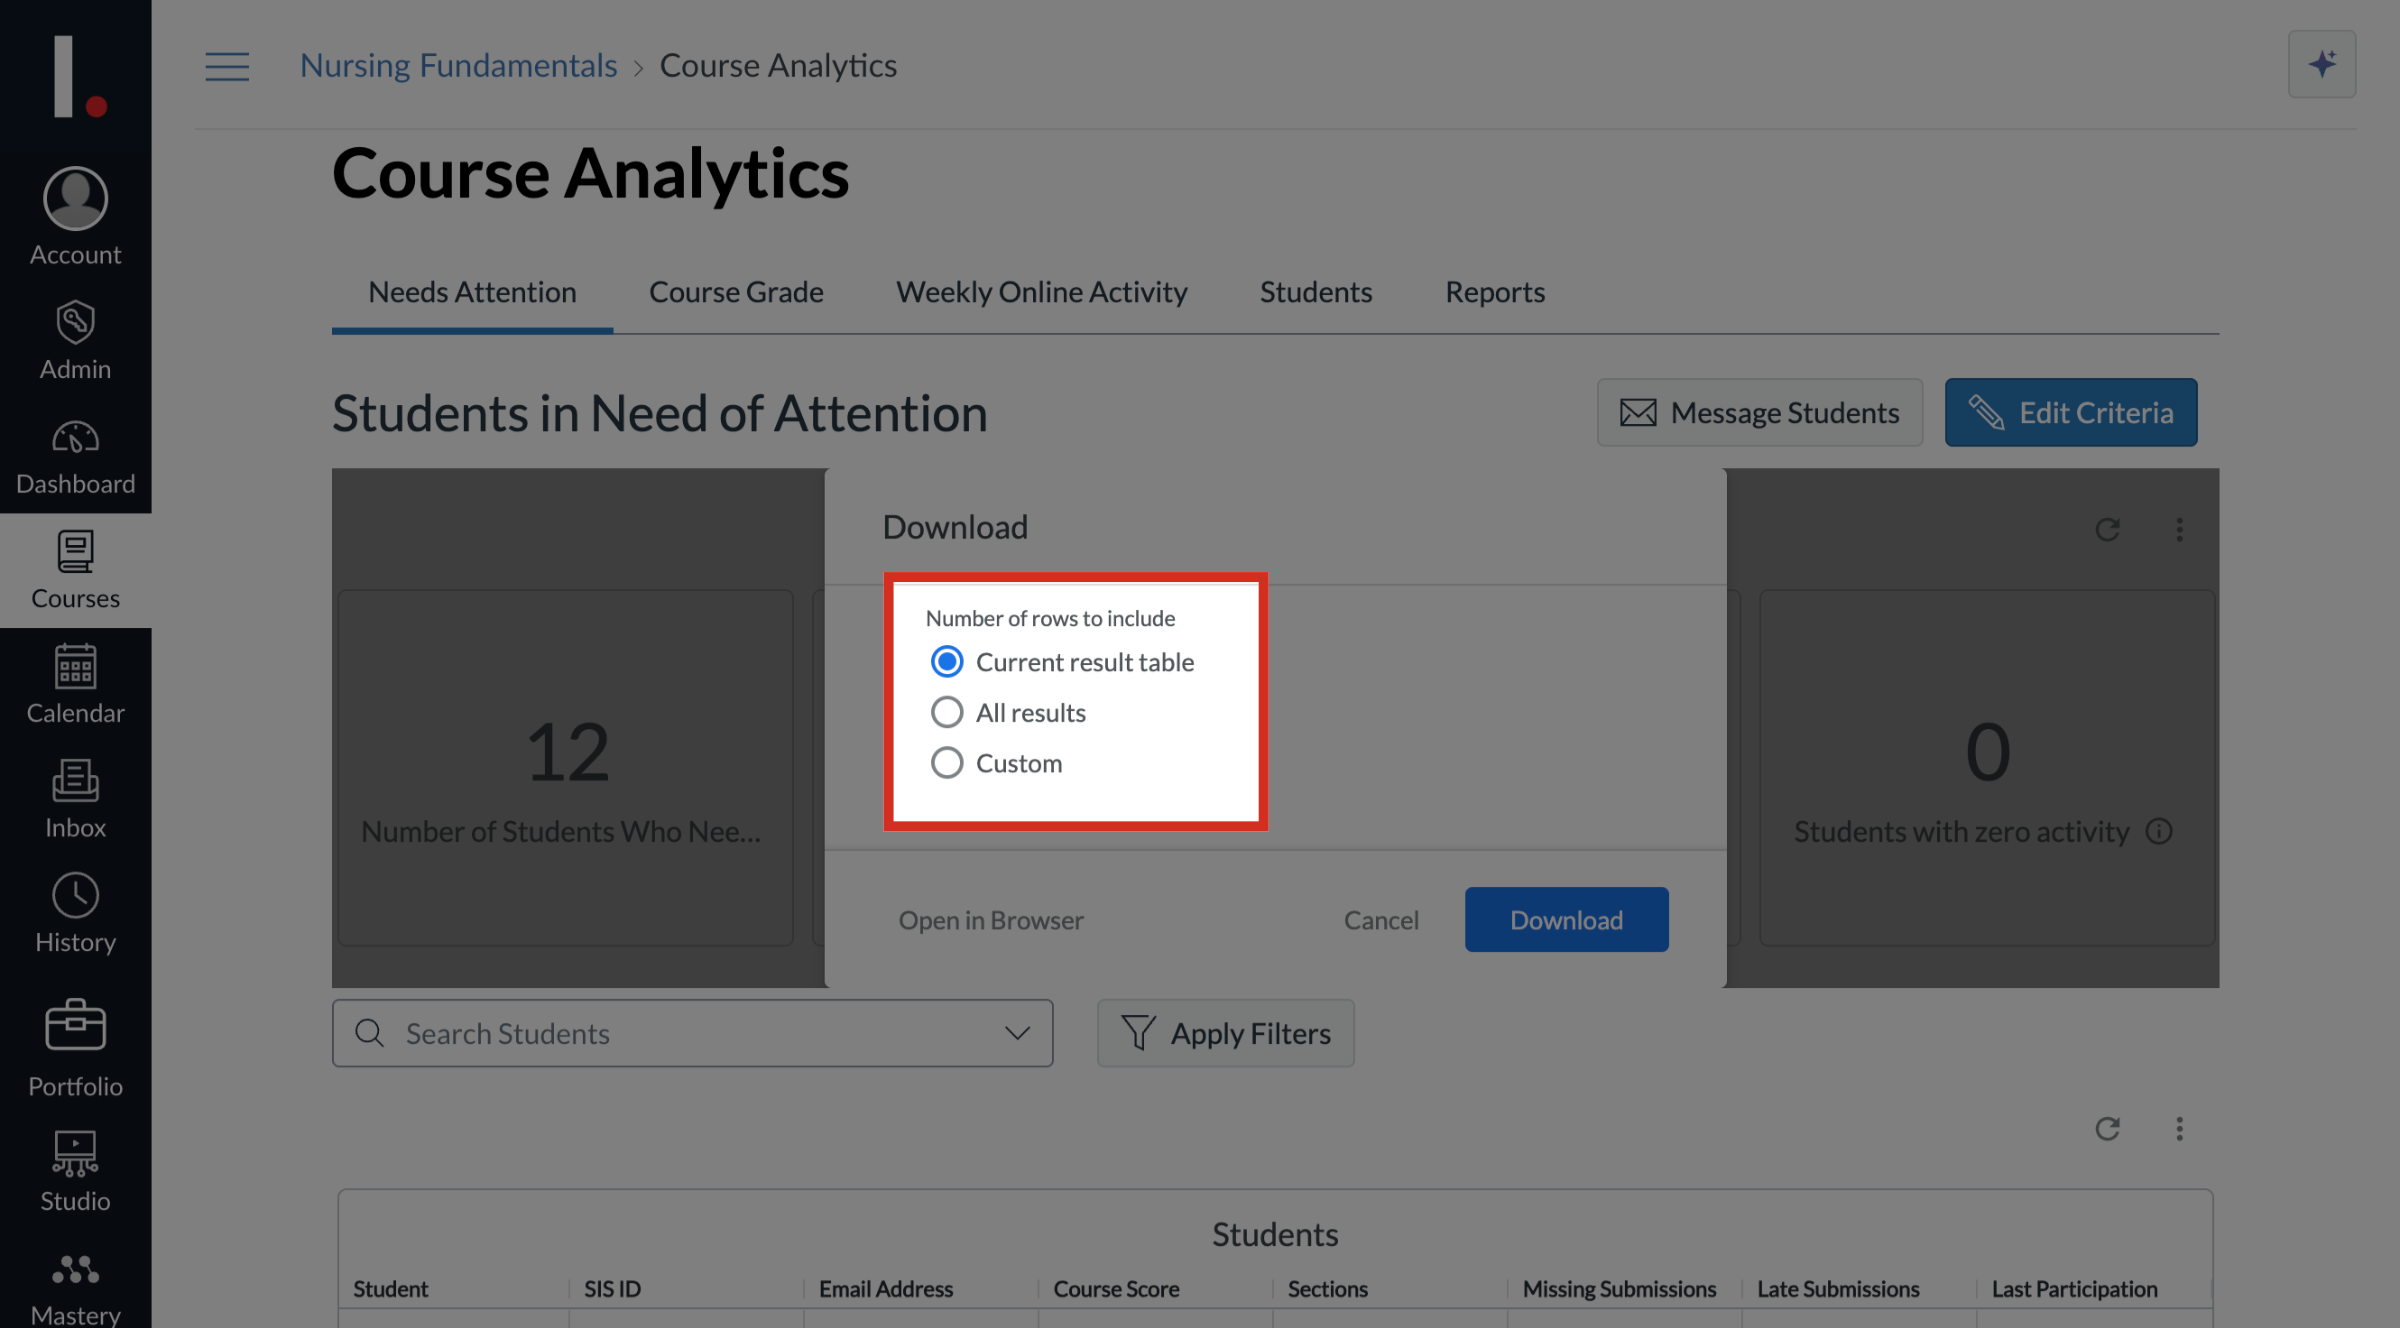
16. Select Number of Rows to Include
The following Number of Rows to Include are available:
Current results table
All results
Custom
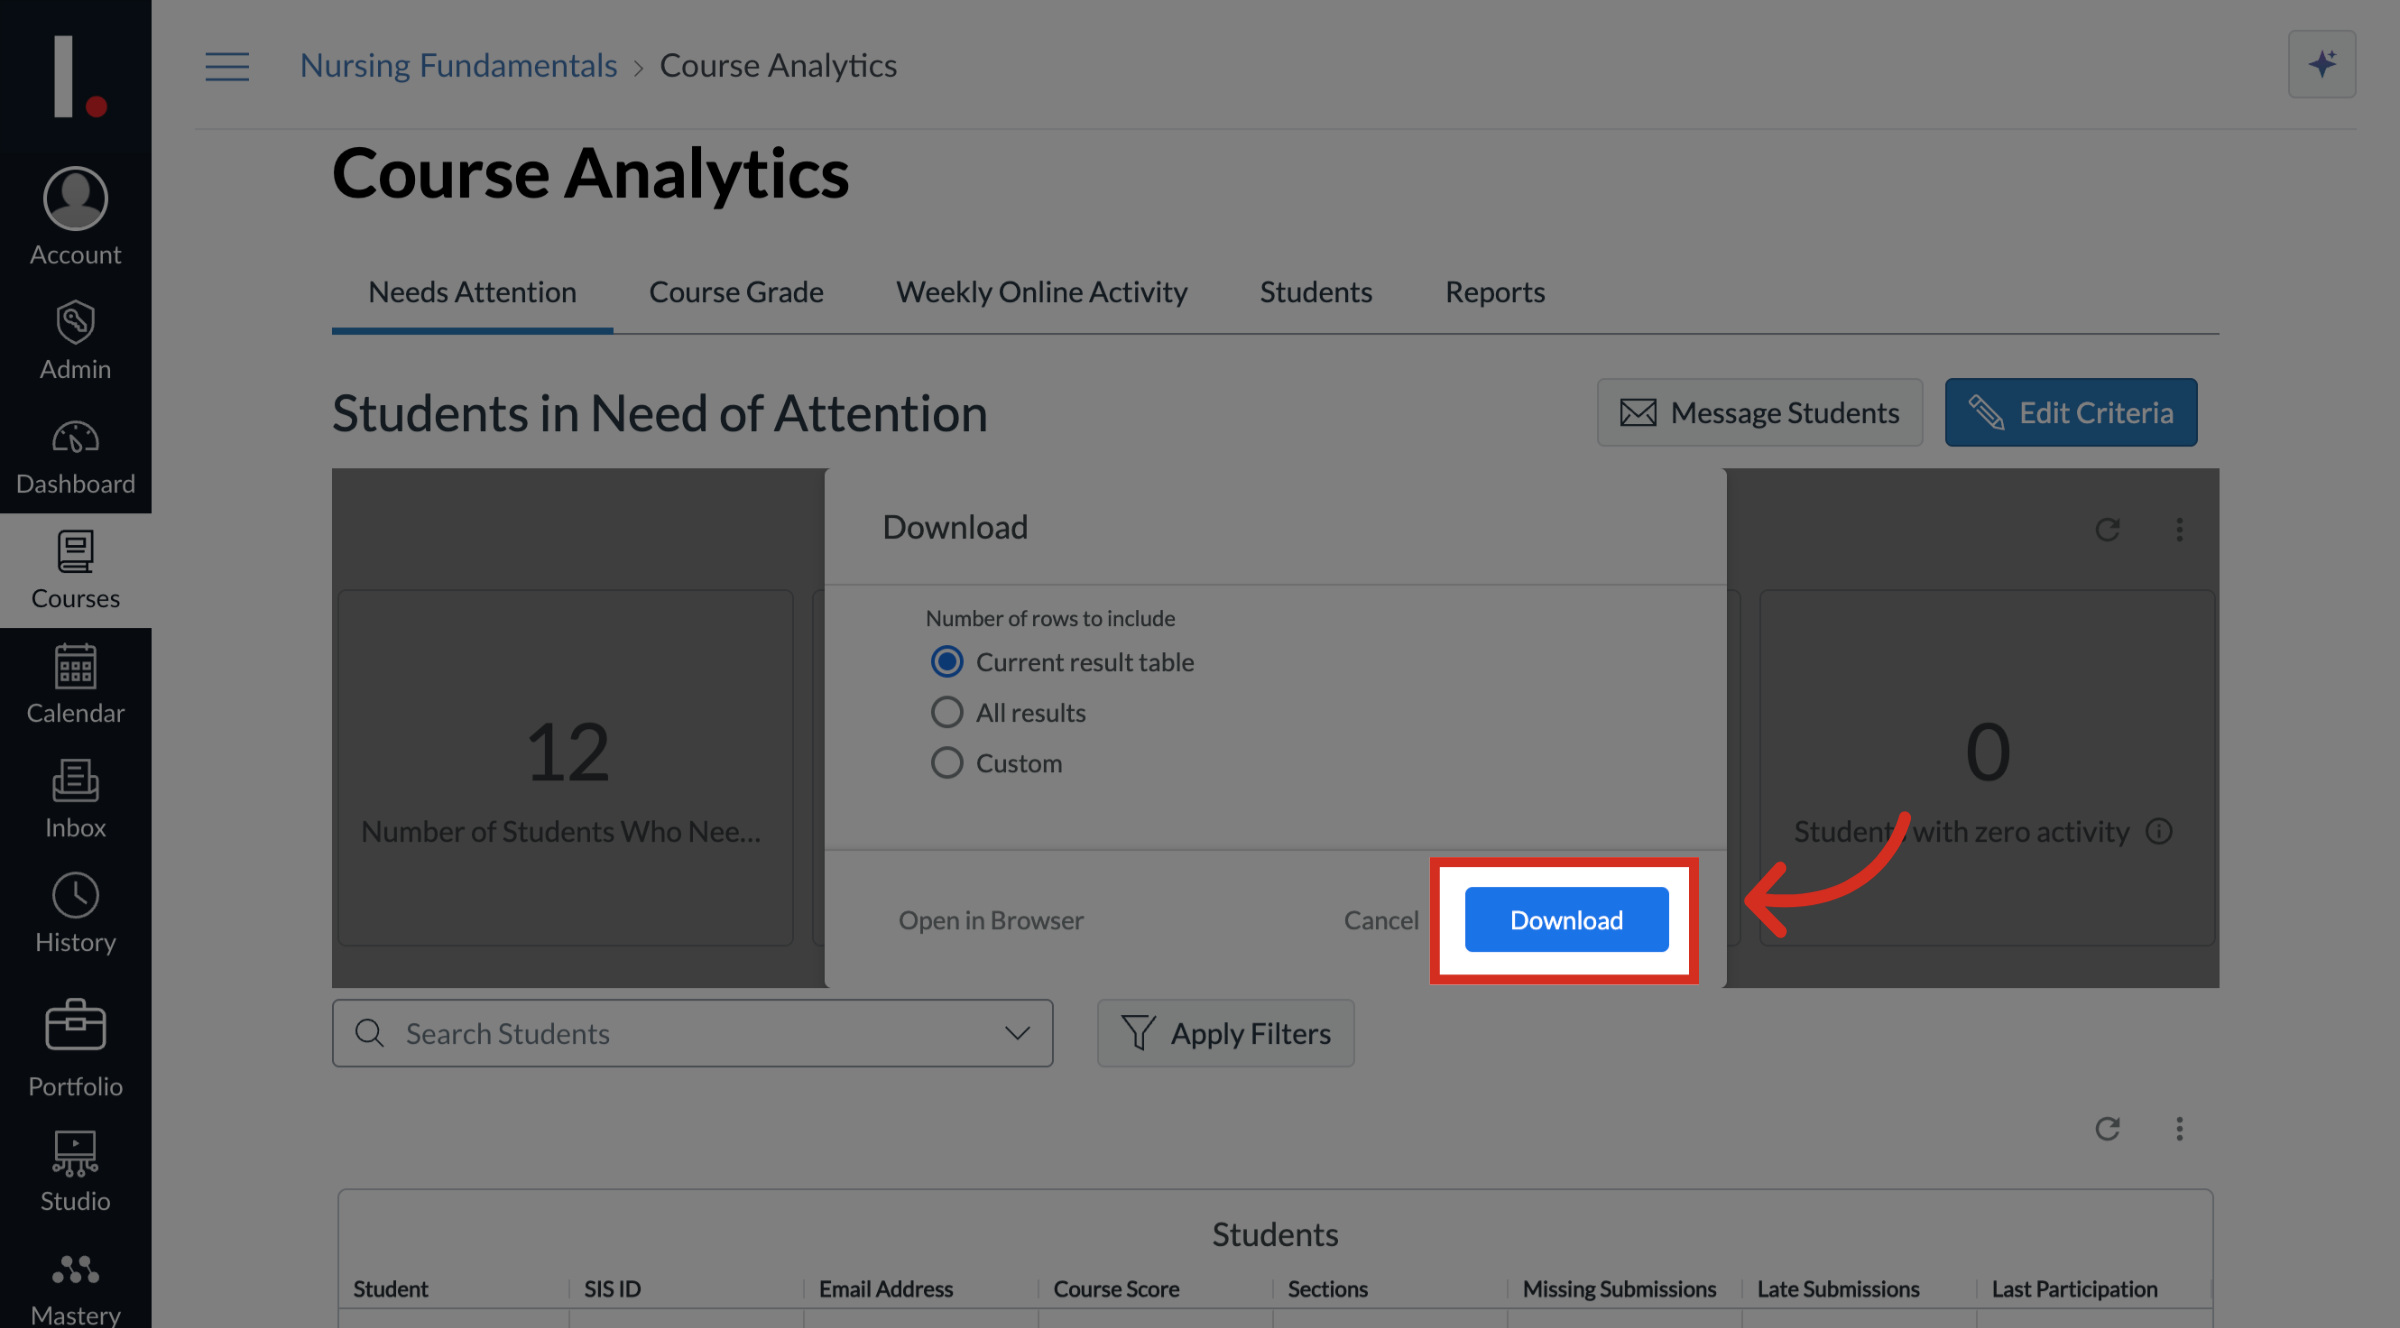
17. Download Data
To download the data, click the Download button.
This guide covered what data is available at the course level for Students in Need of Attention.
