How do I view the Course Activity Report in the Impact Dashboard?
The Course Activity Report compares the usage of specific tools for courses based on your search criteria.
How do I view the Course Activity Report in the Impact Dashboard?
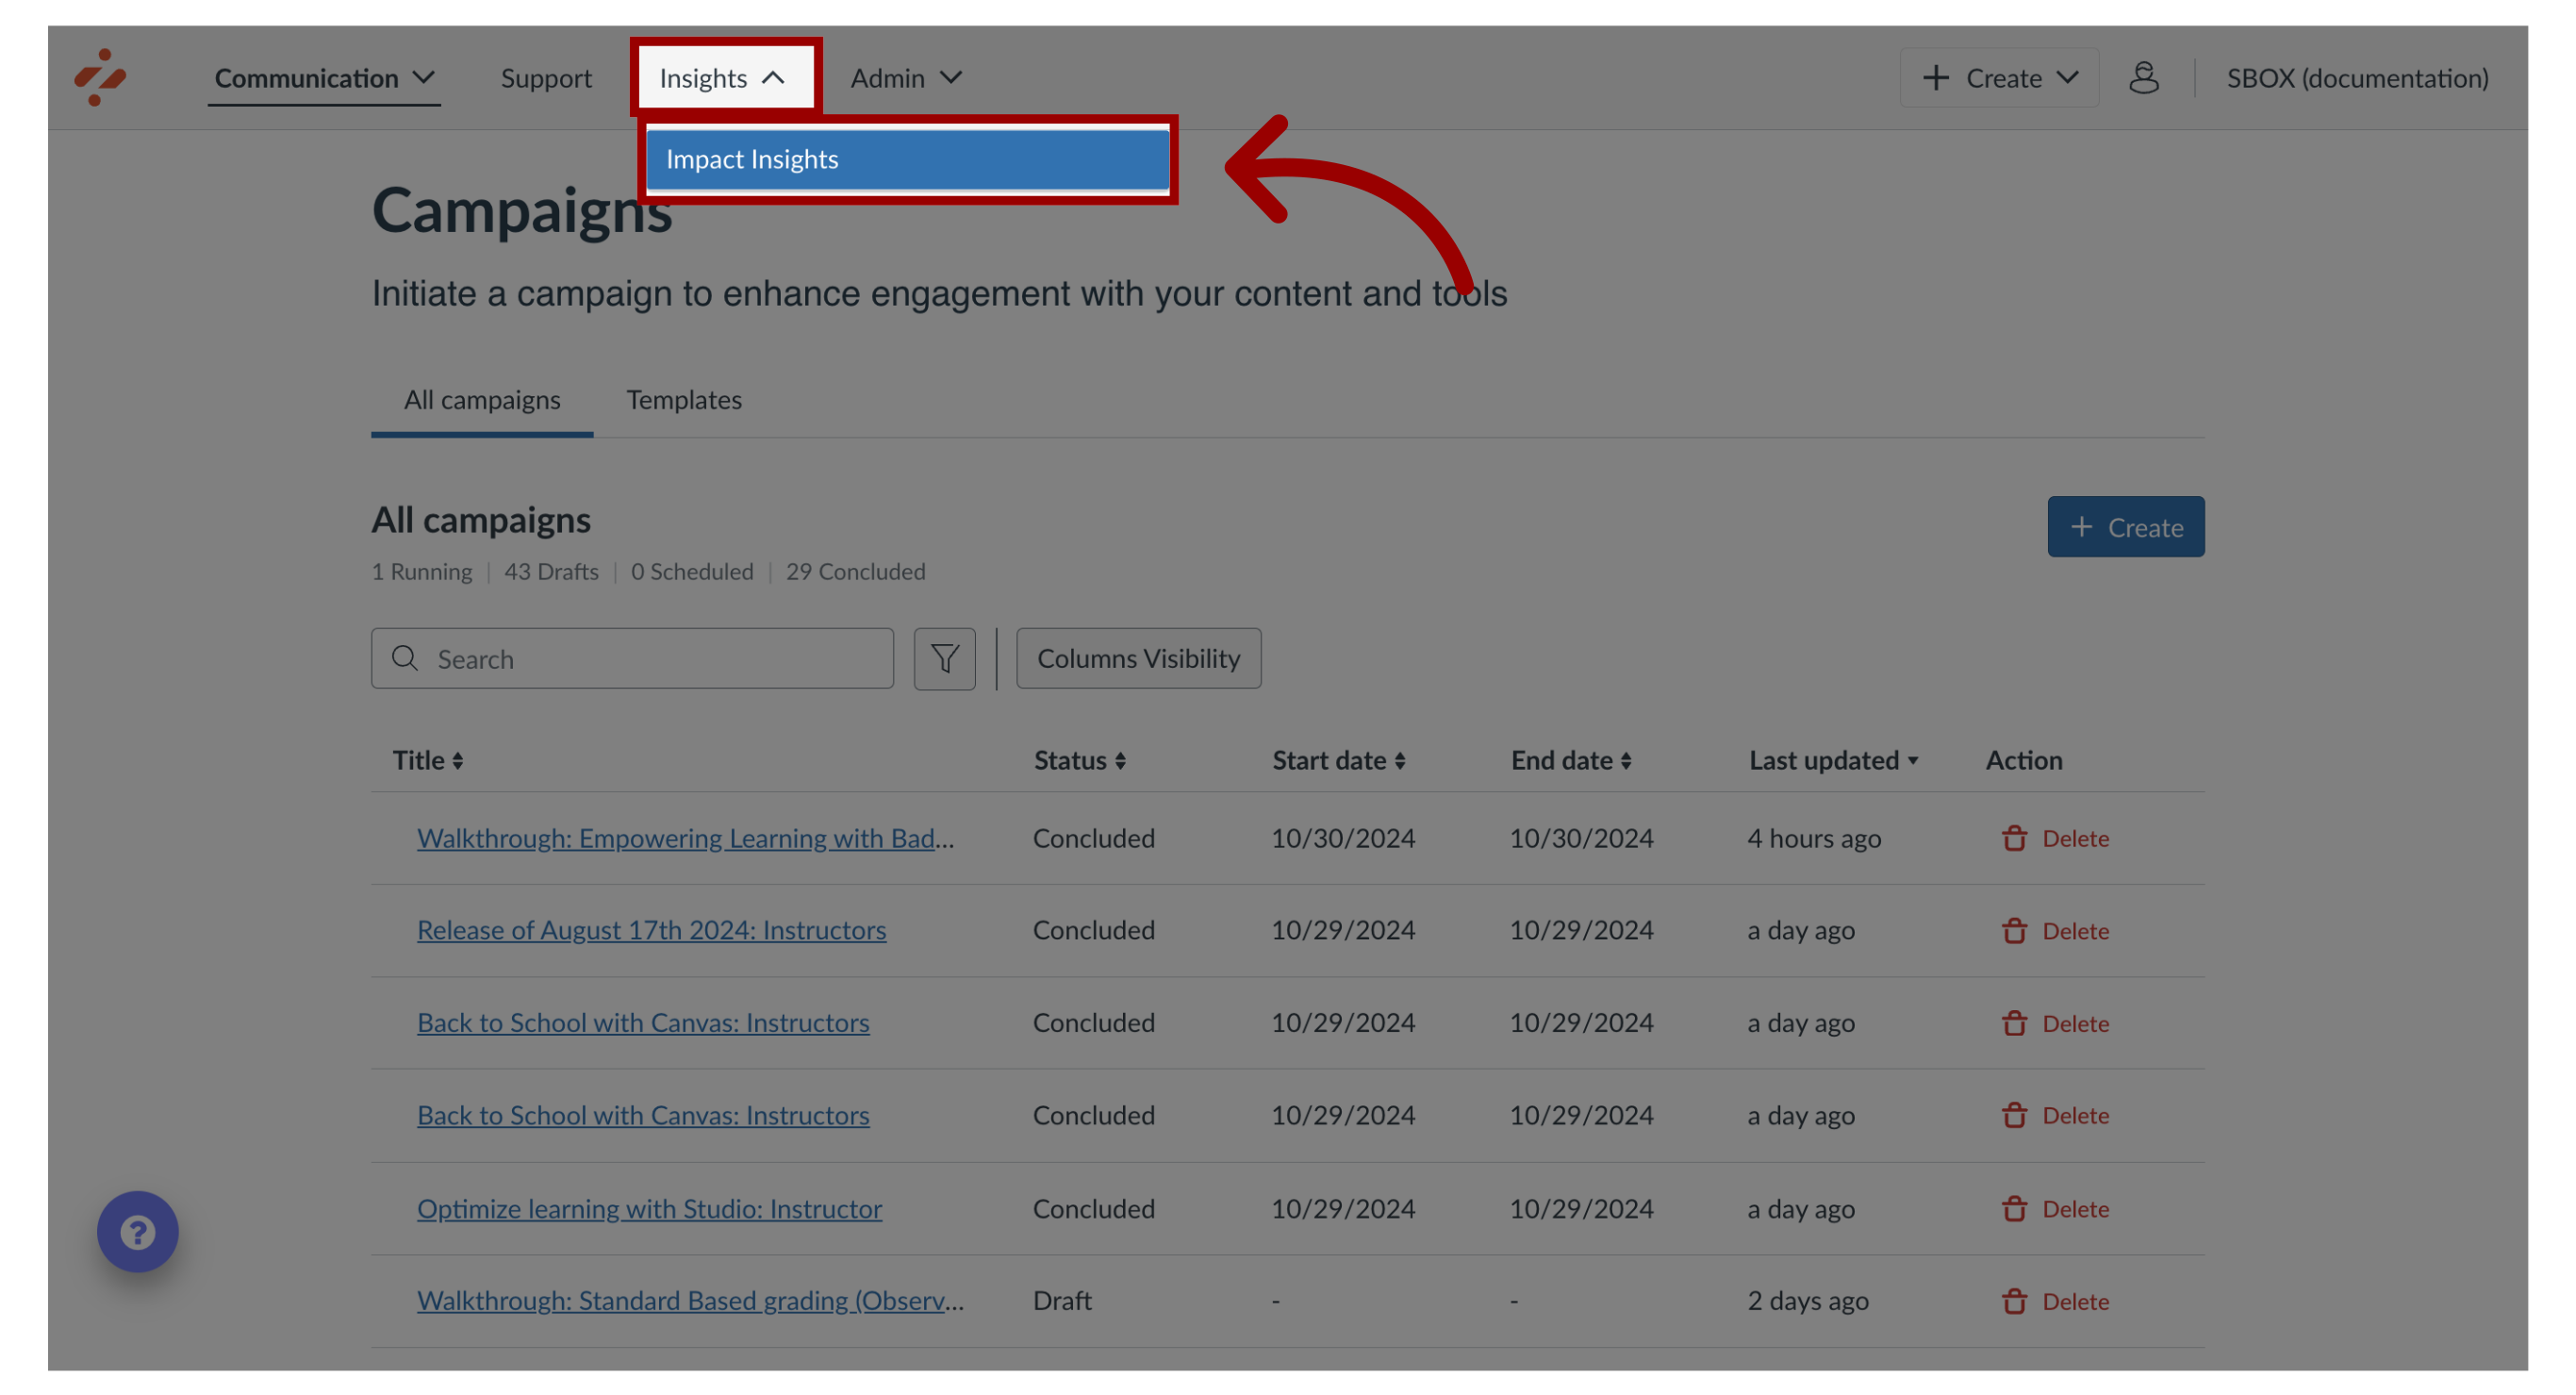
1. Open Impact Insights
In the Global Navigation, click the Insights dropdown menu. Then click the Impact Insights link.
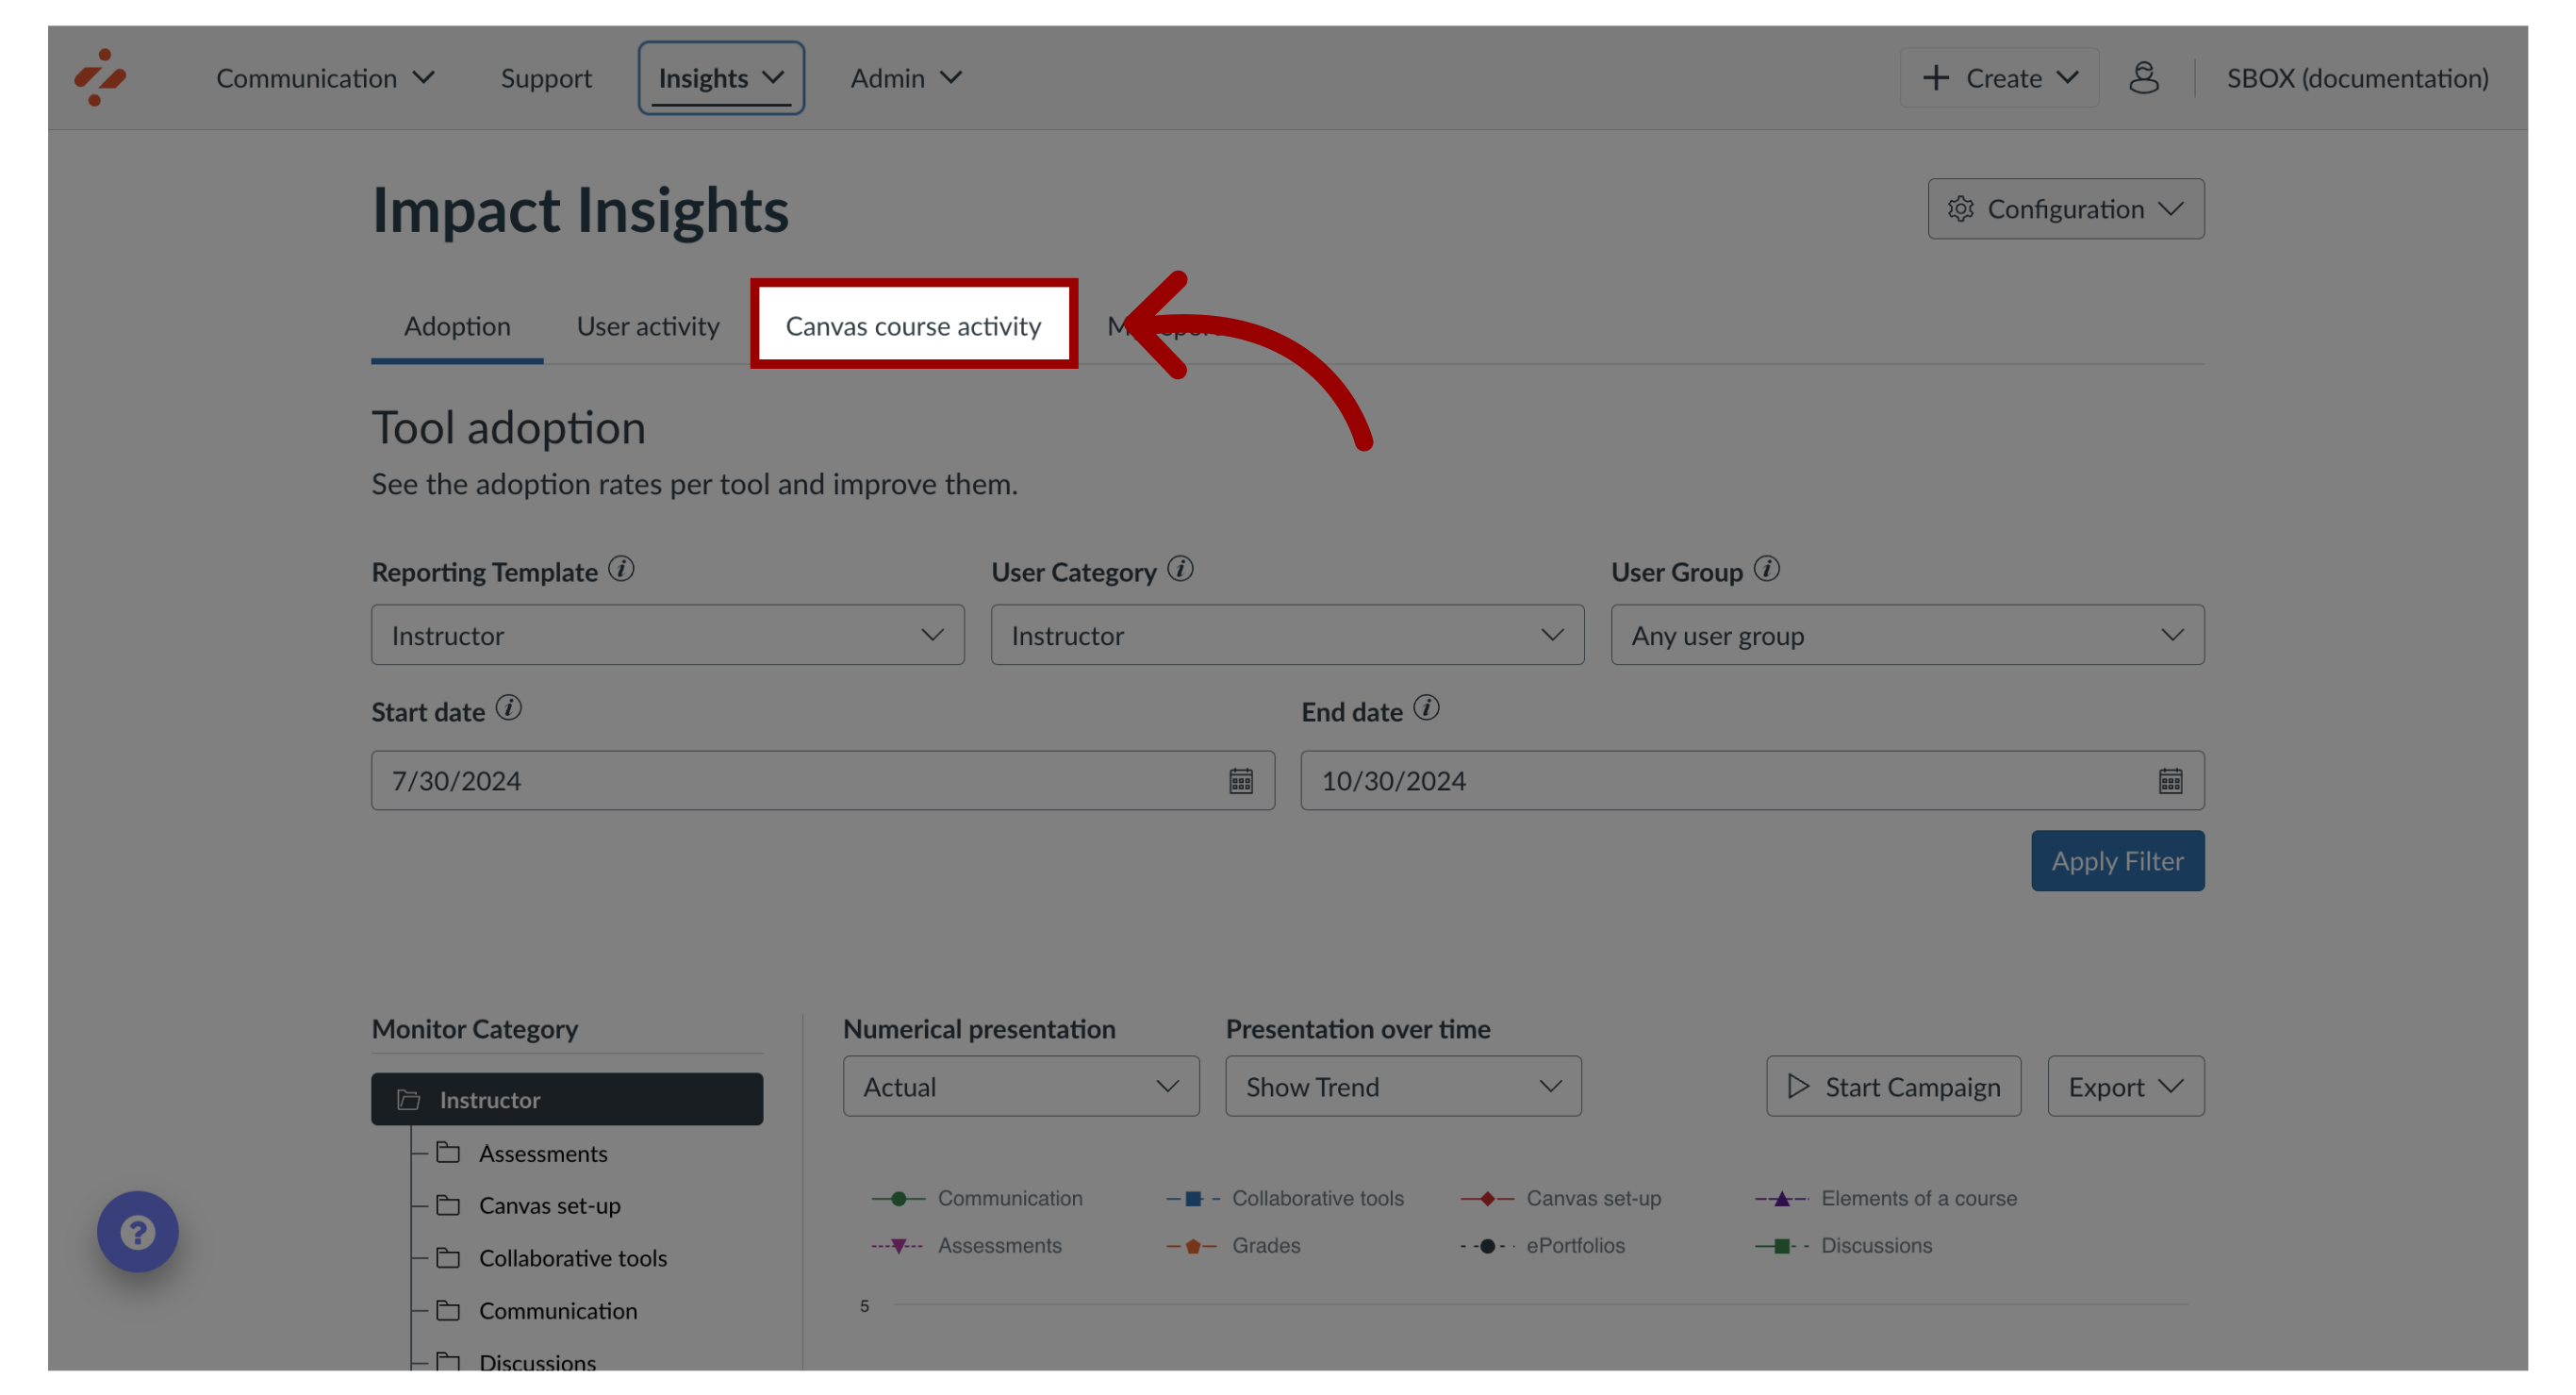
2. Open Canvas Course Activity Report
Click the Canvas Course Activity link.
3. Filter Data
The data presented in the Course Activity Report can be filtered using the global filter bar at the top of the page.
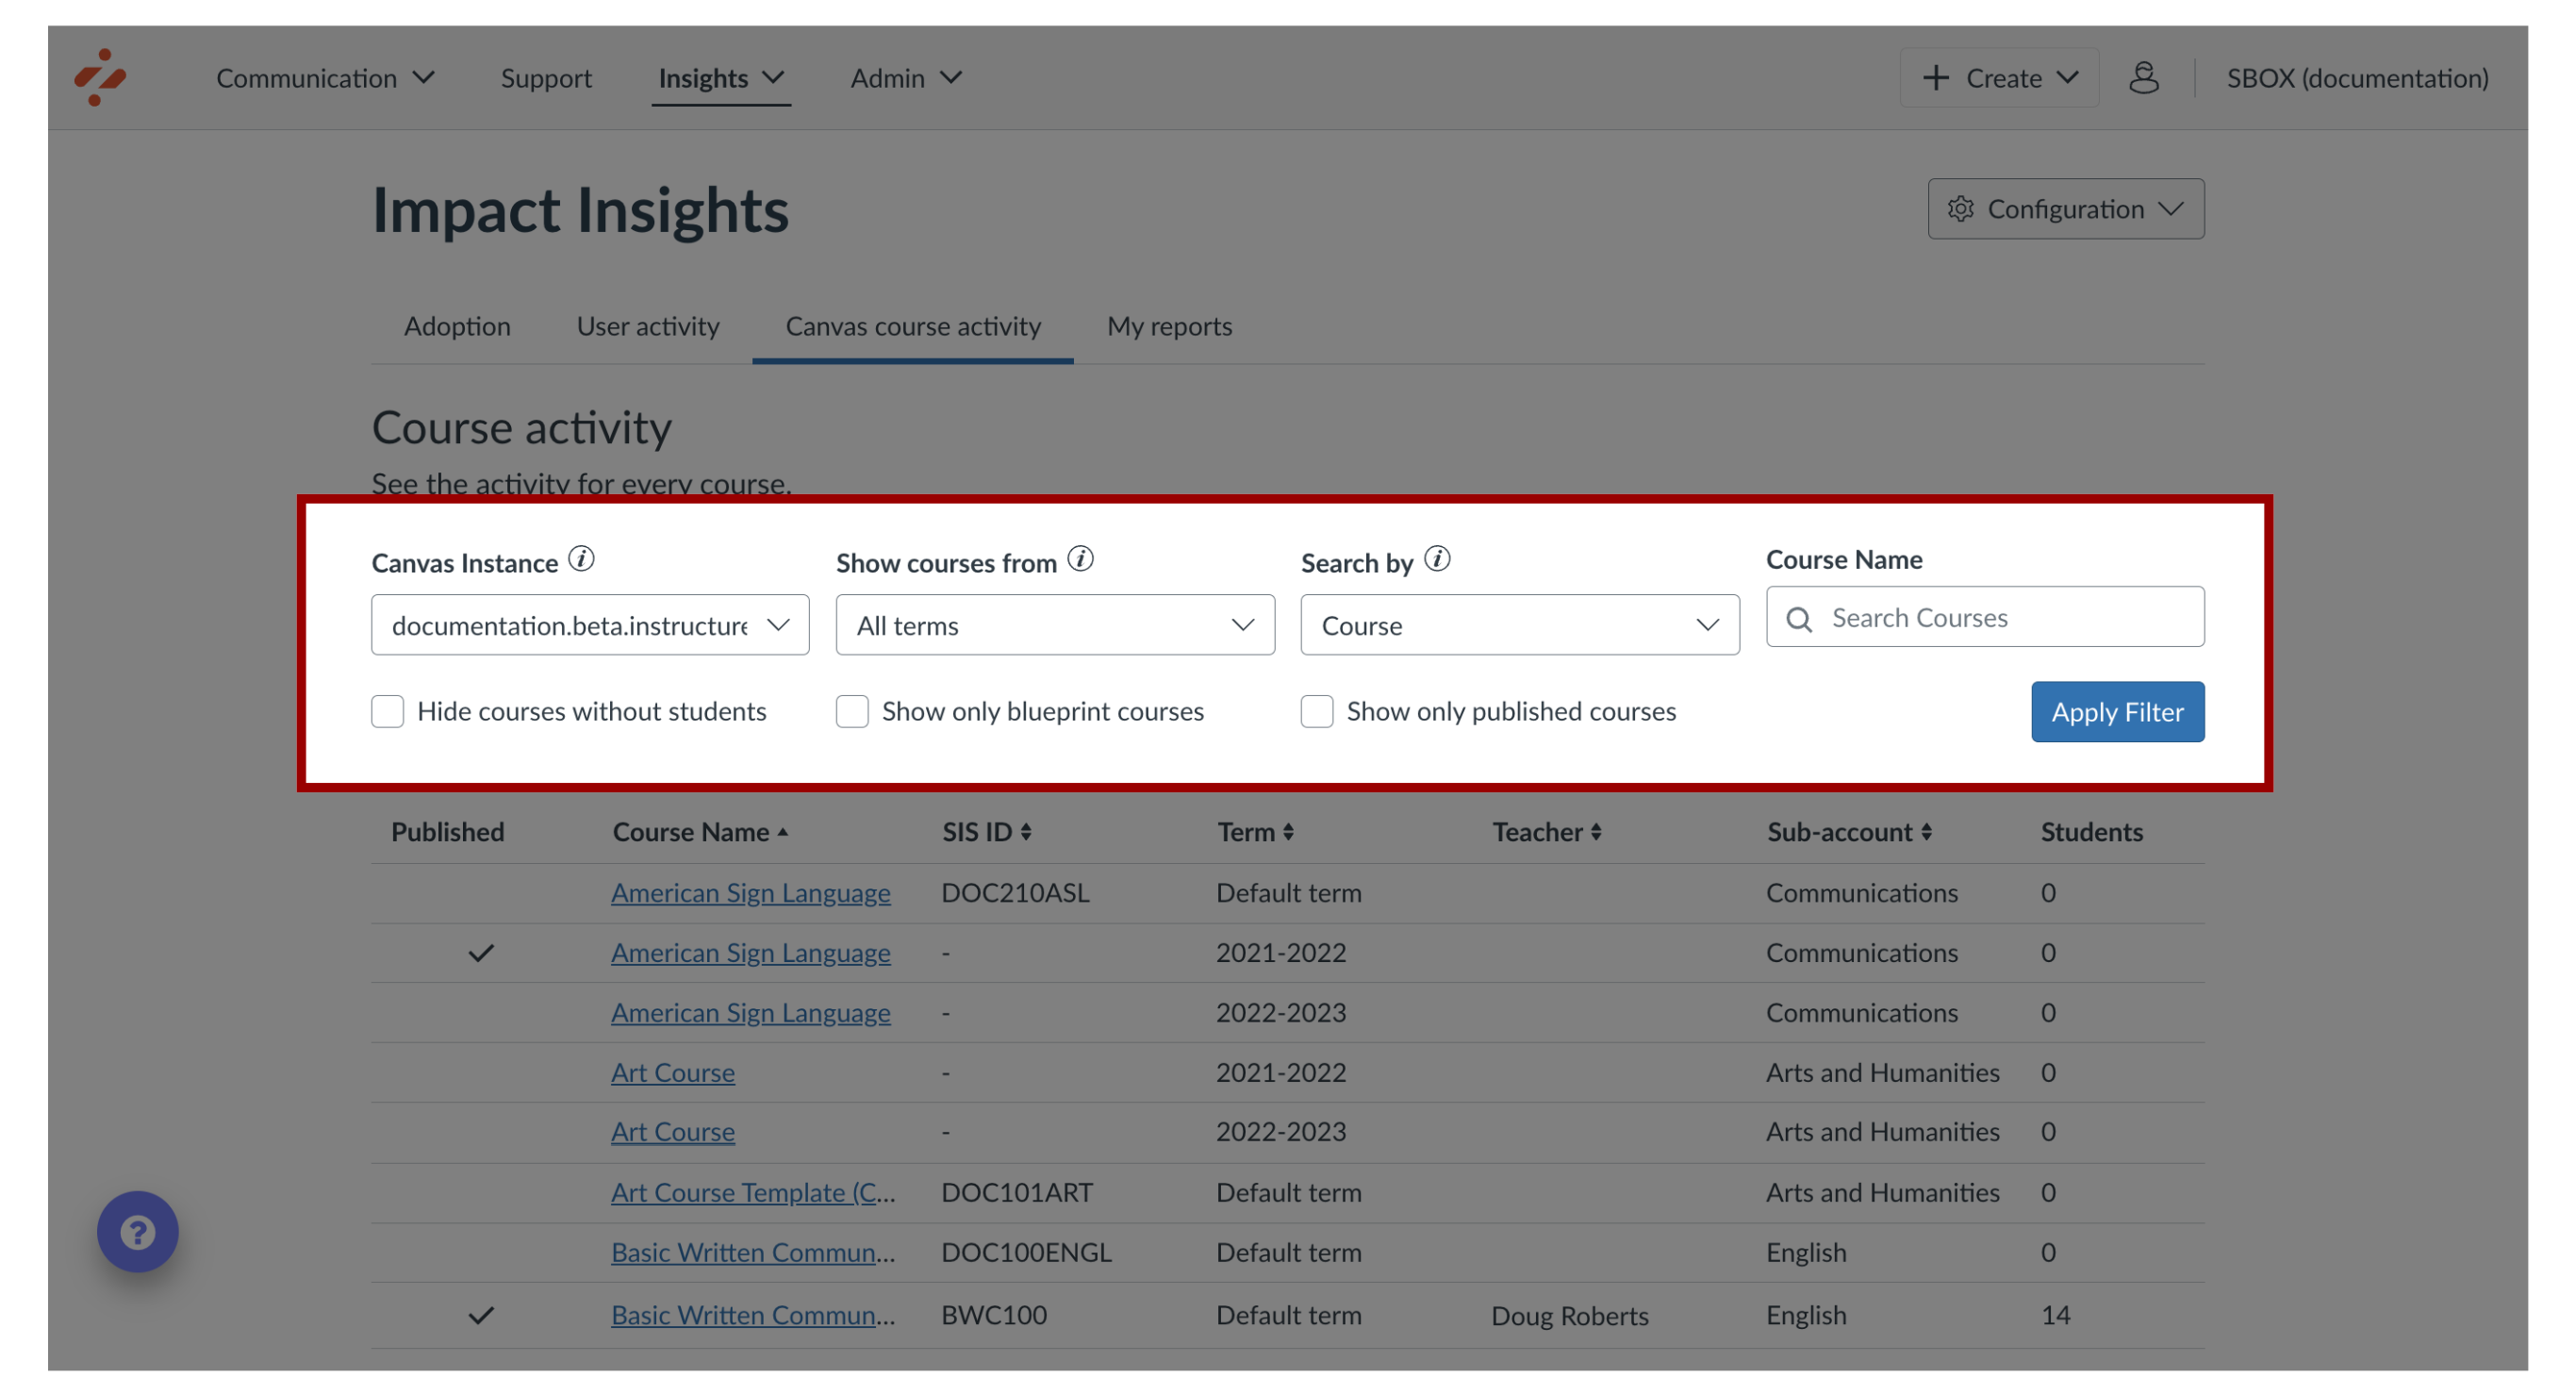
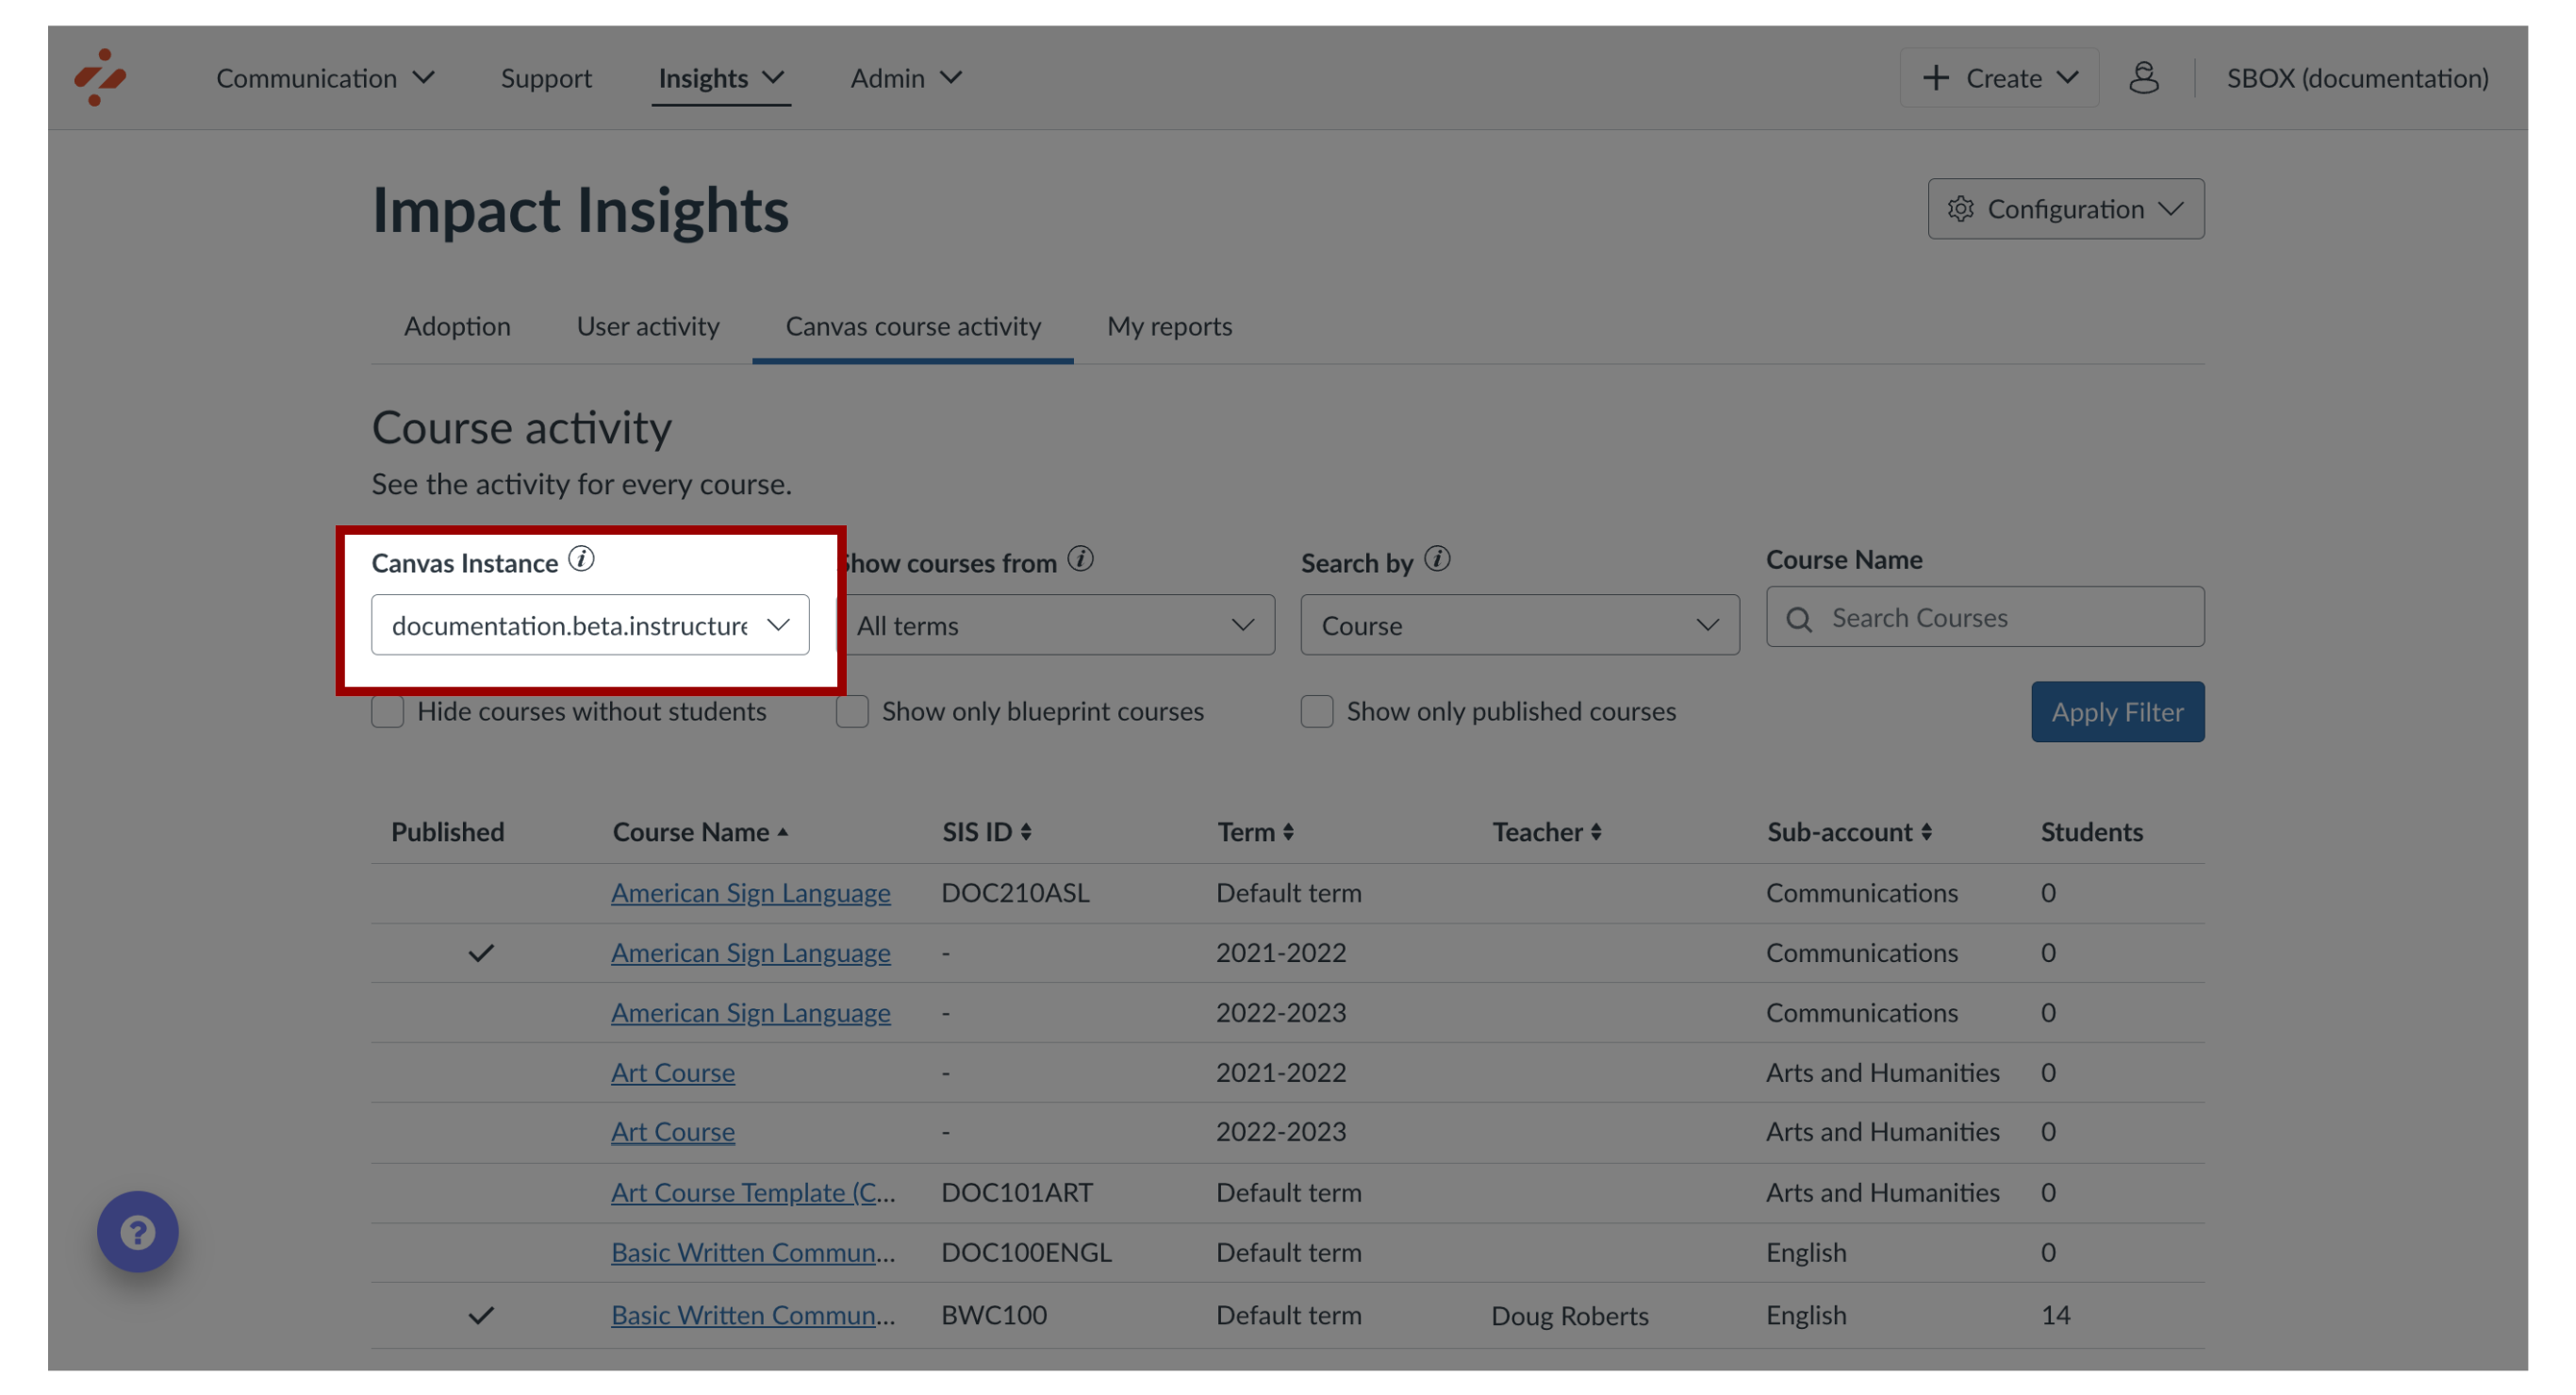
4. Canvas Instance
To switch between Canvas instances, click the Canvas Instance drop-down menu.
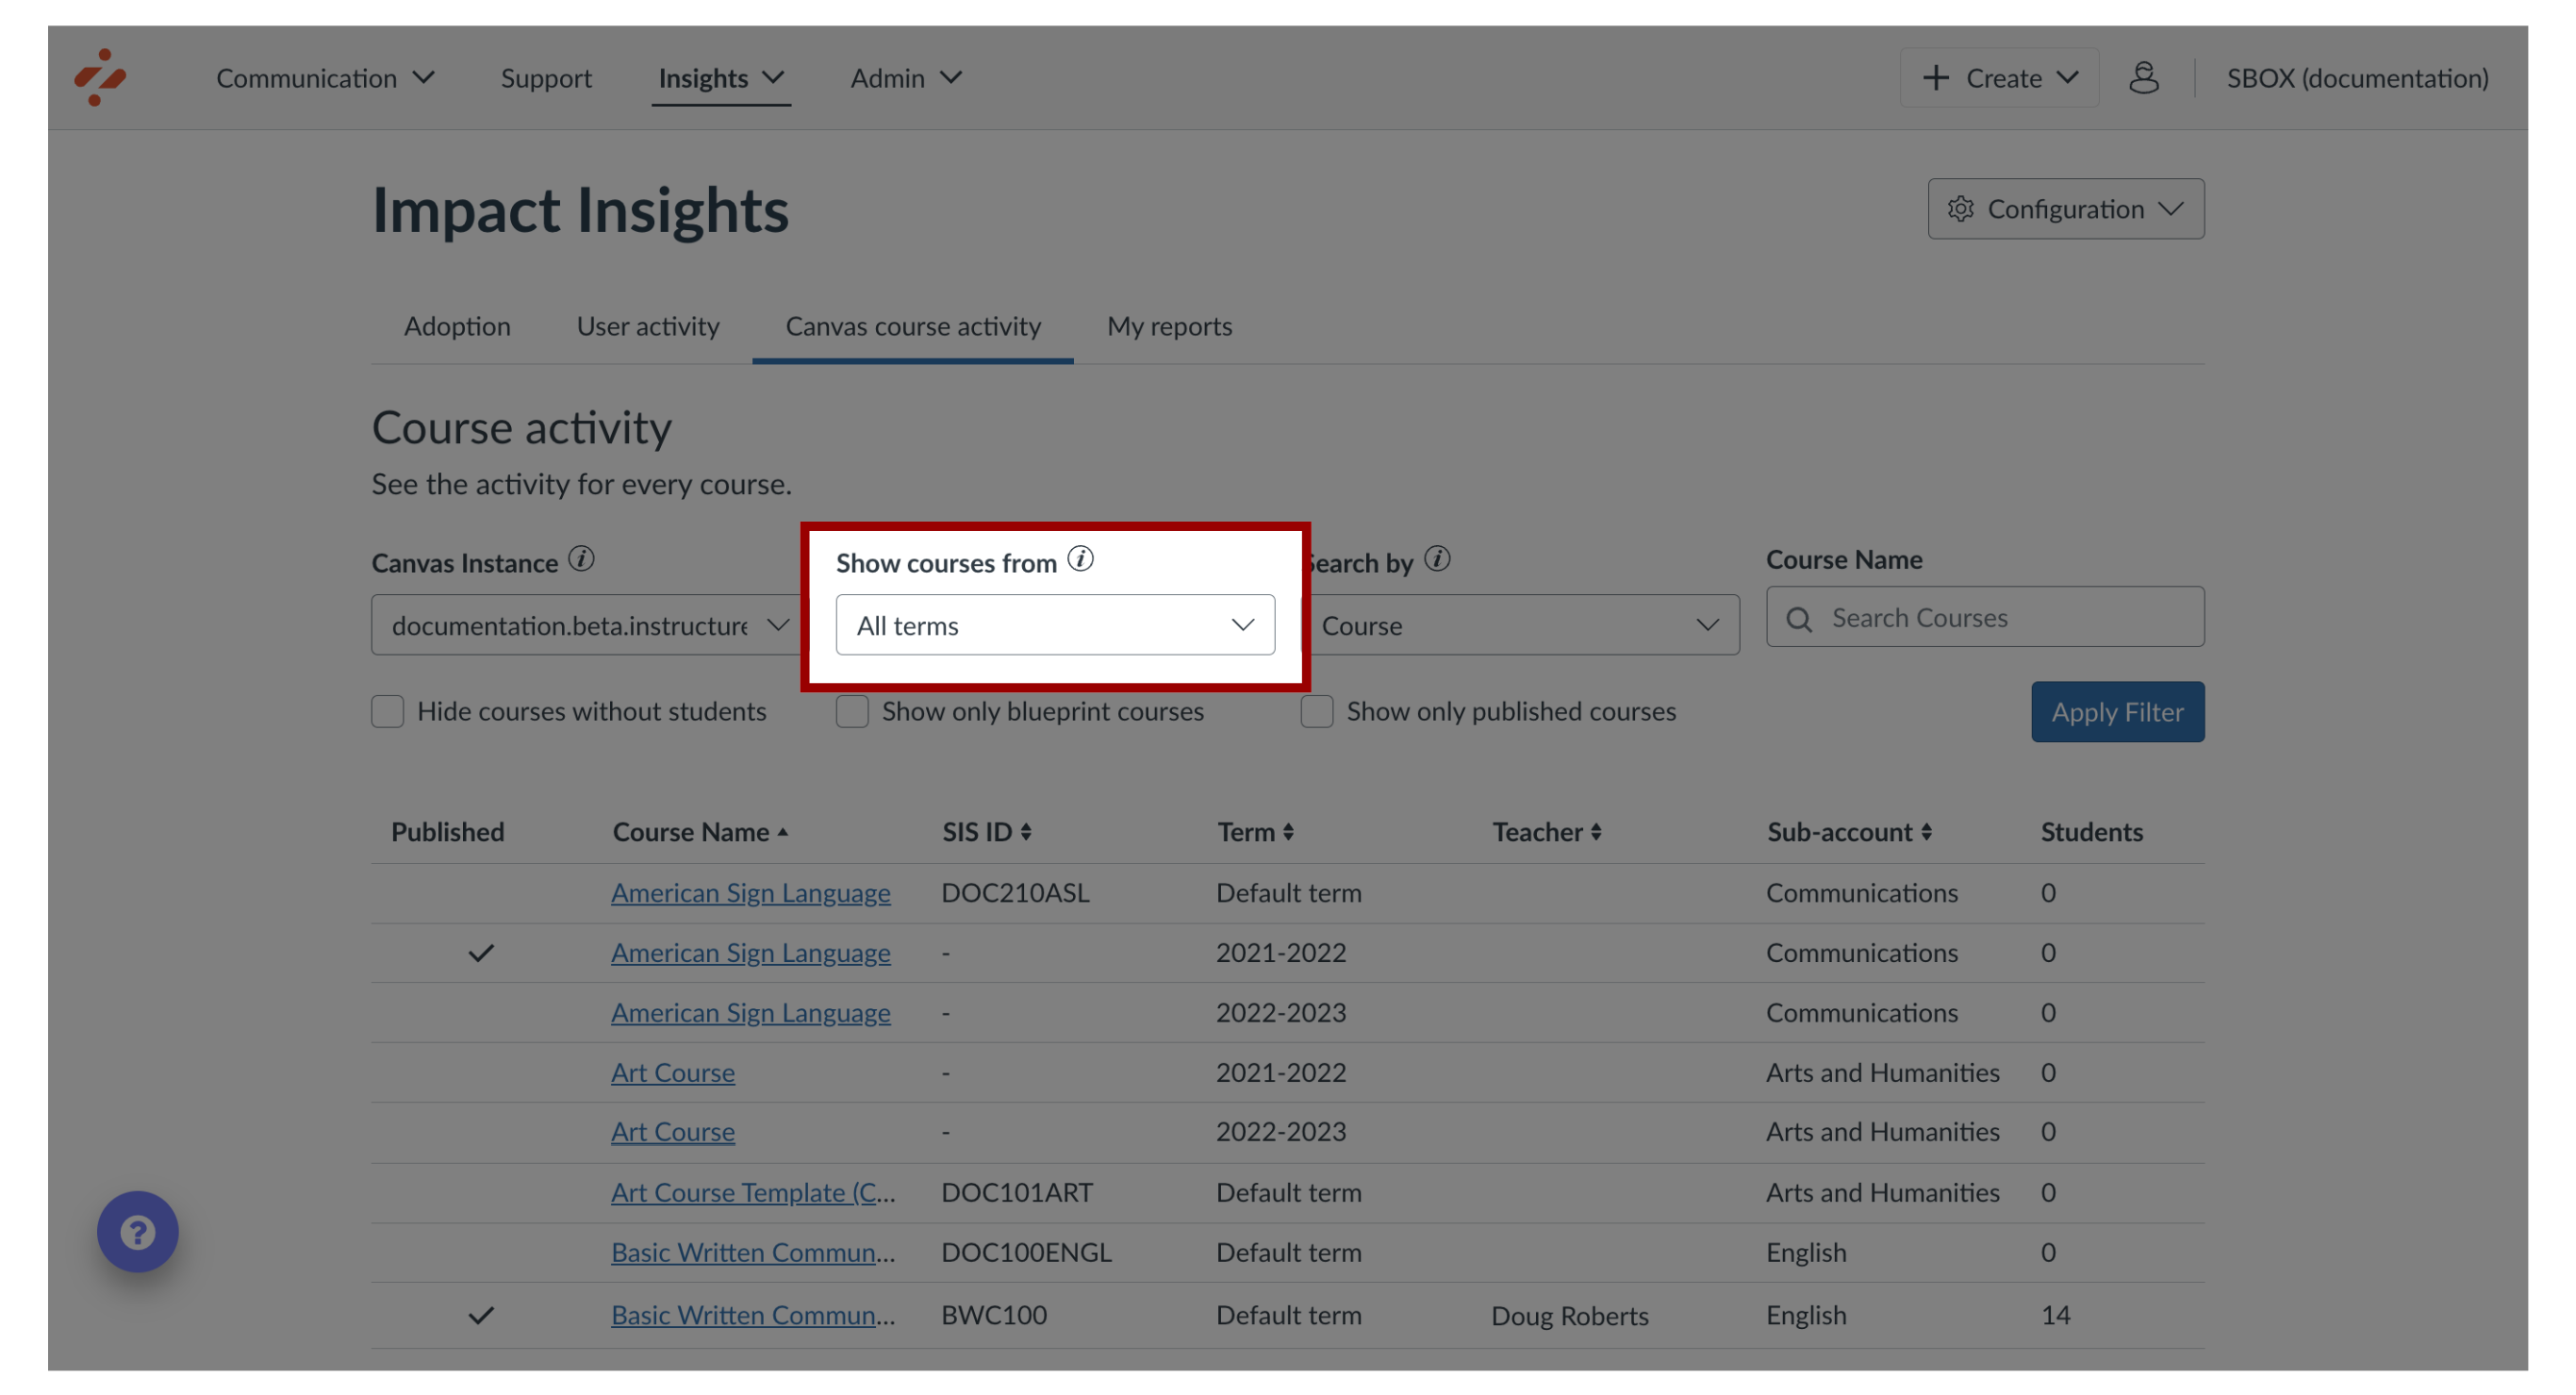
5. Show Courses From
To filter by courses, click the Show courses from drop-down menu.
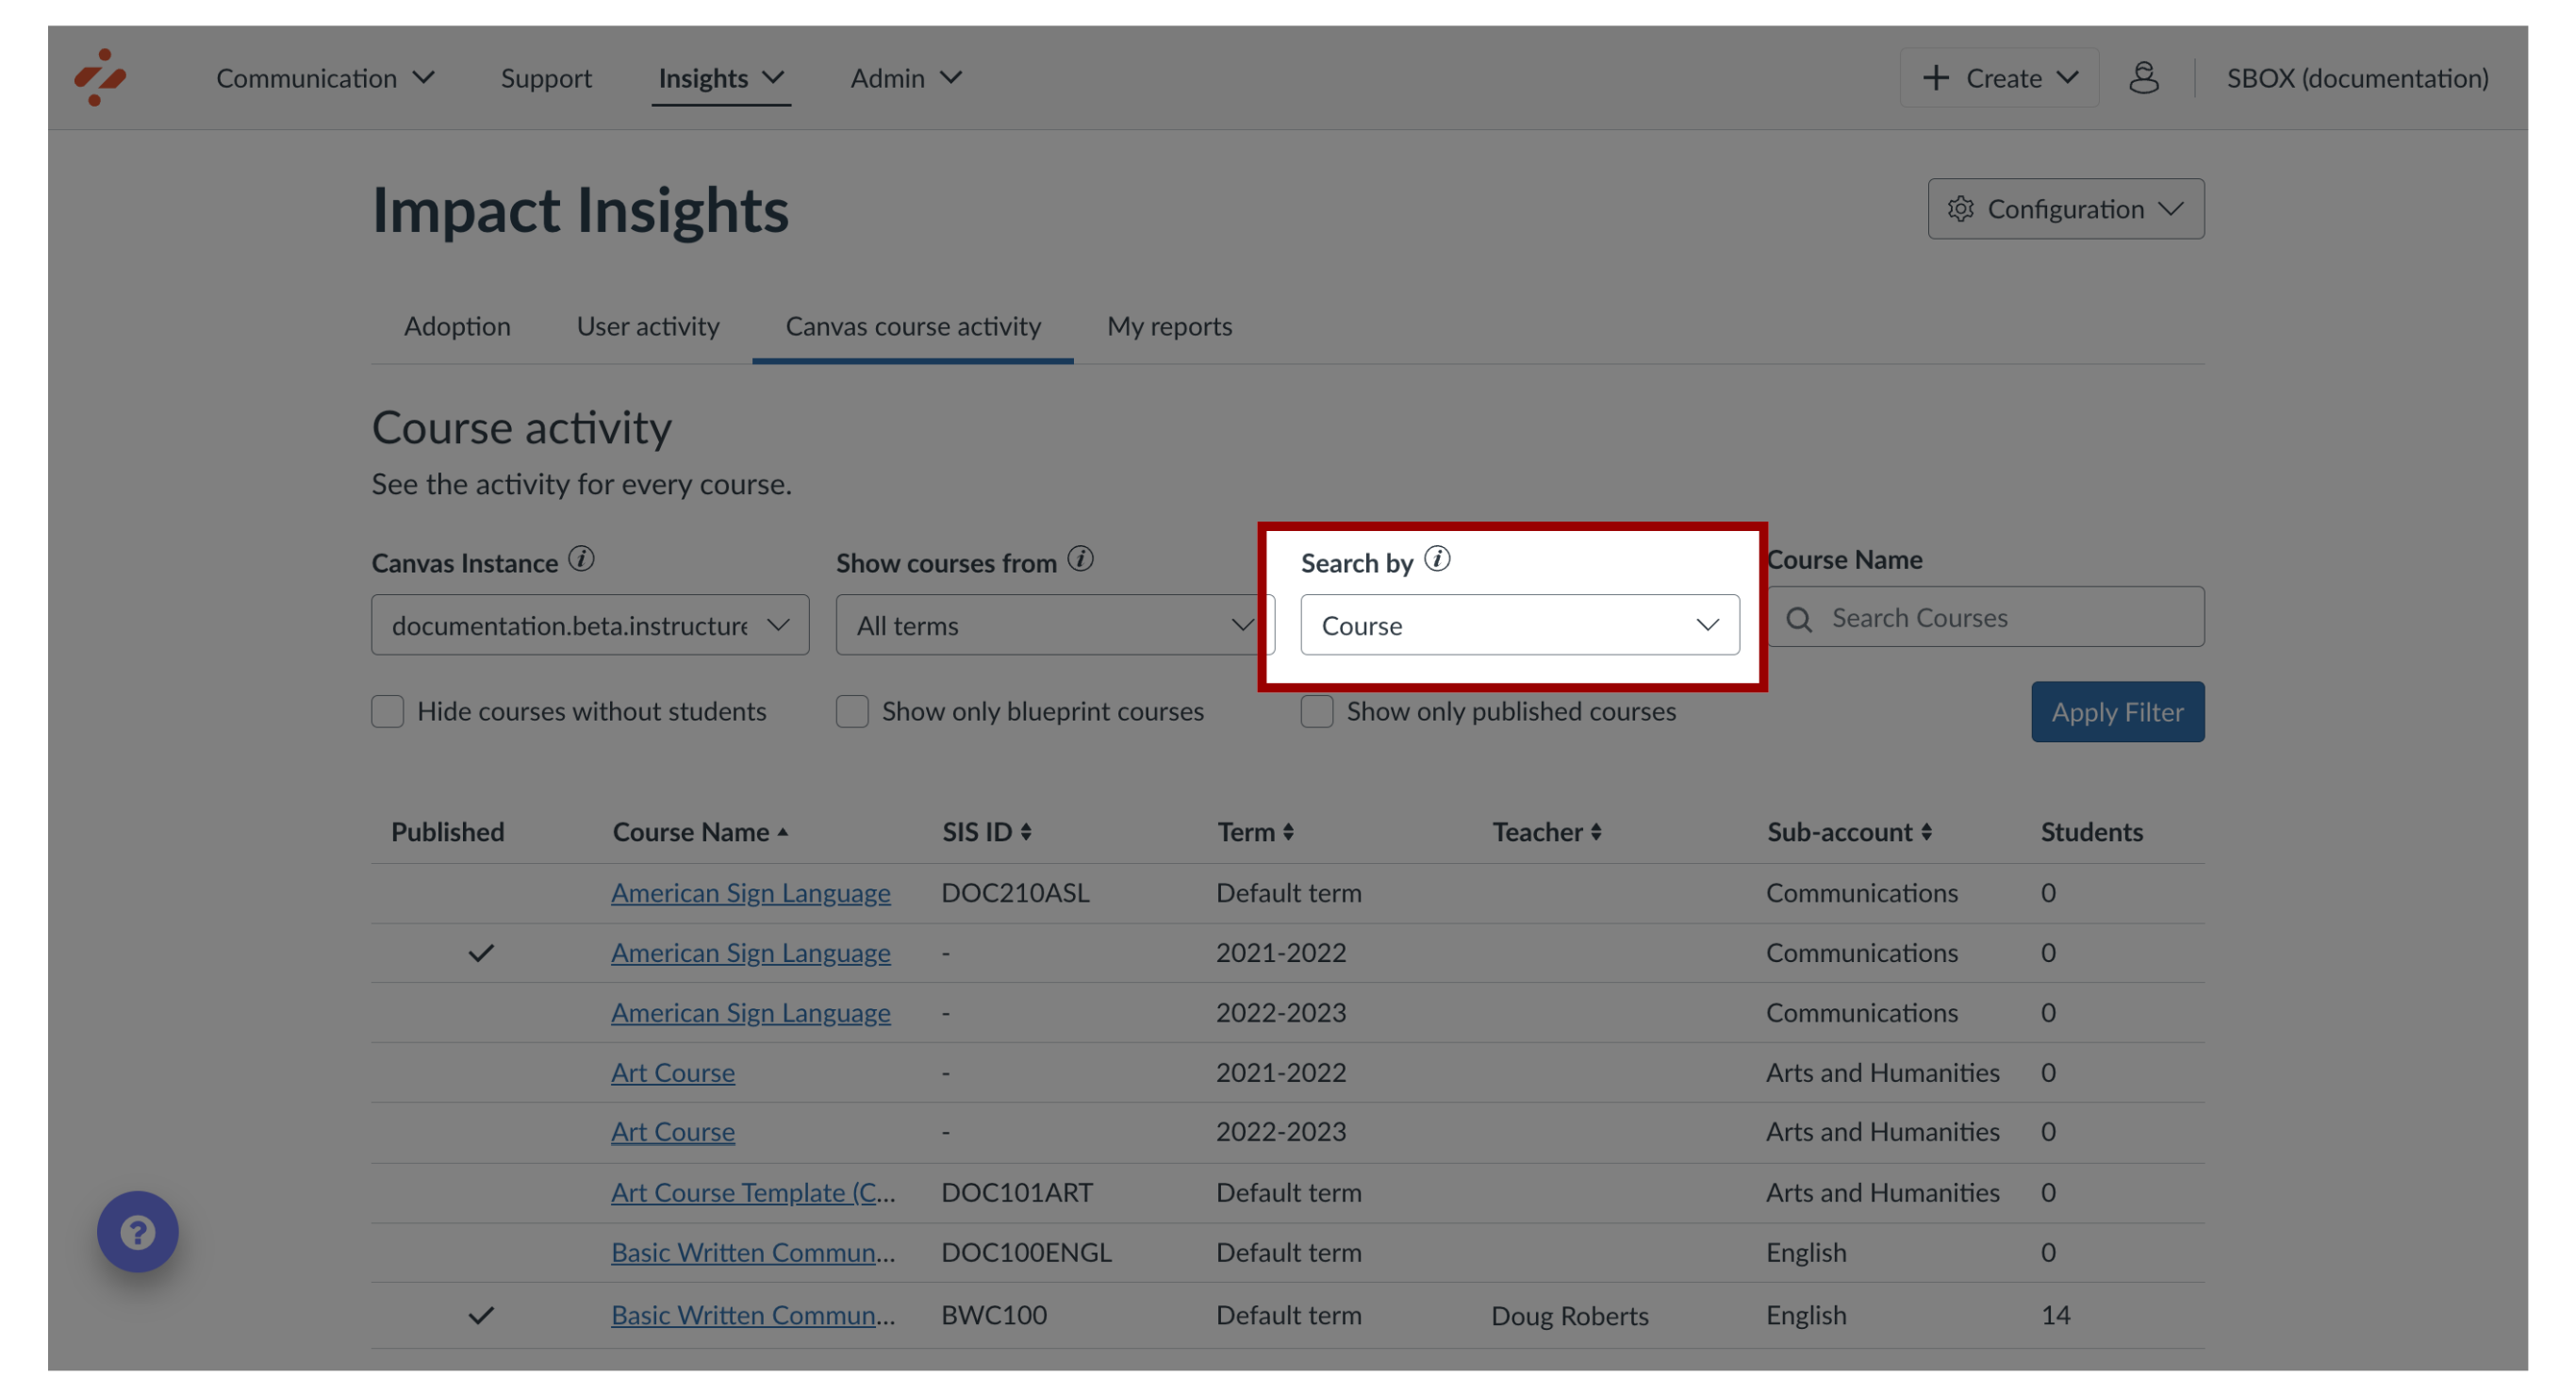
6. Search by
To filter by Courses or Teachers, click the Course drop-down menu.
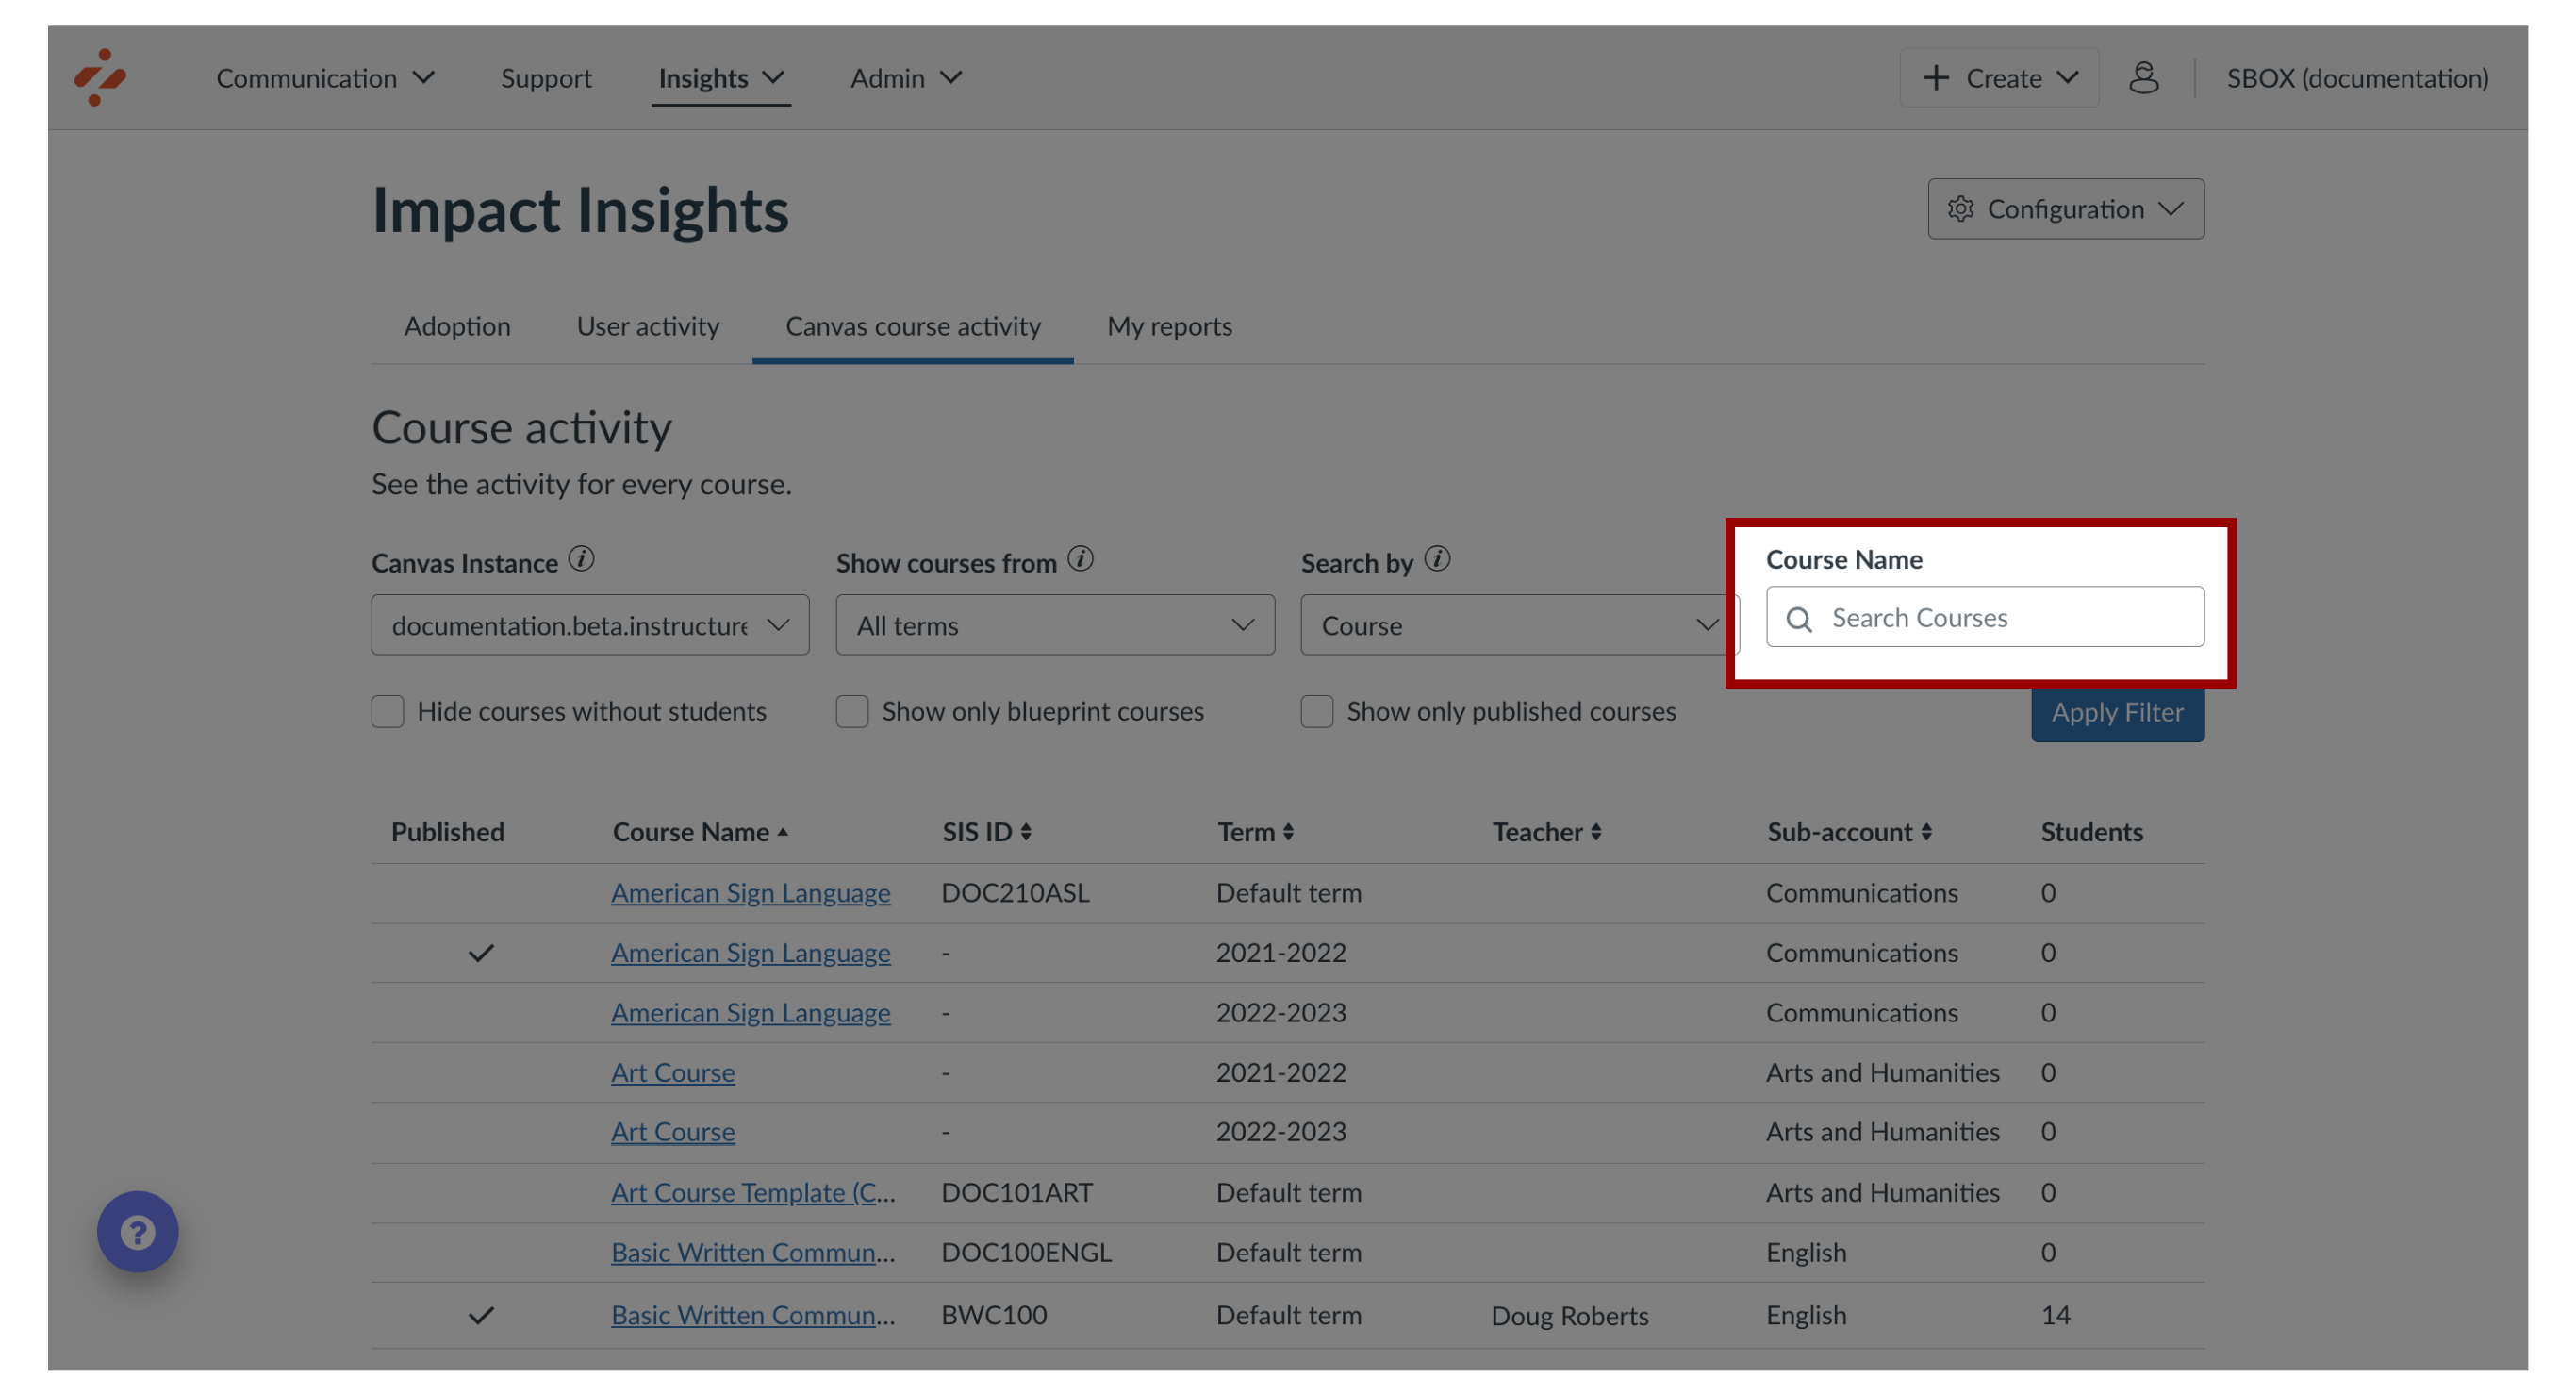
7. Course Name
To search and filter by a course, click the Search Courses search bar.
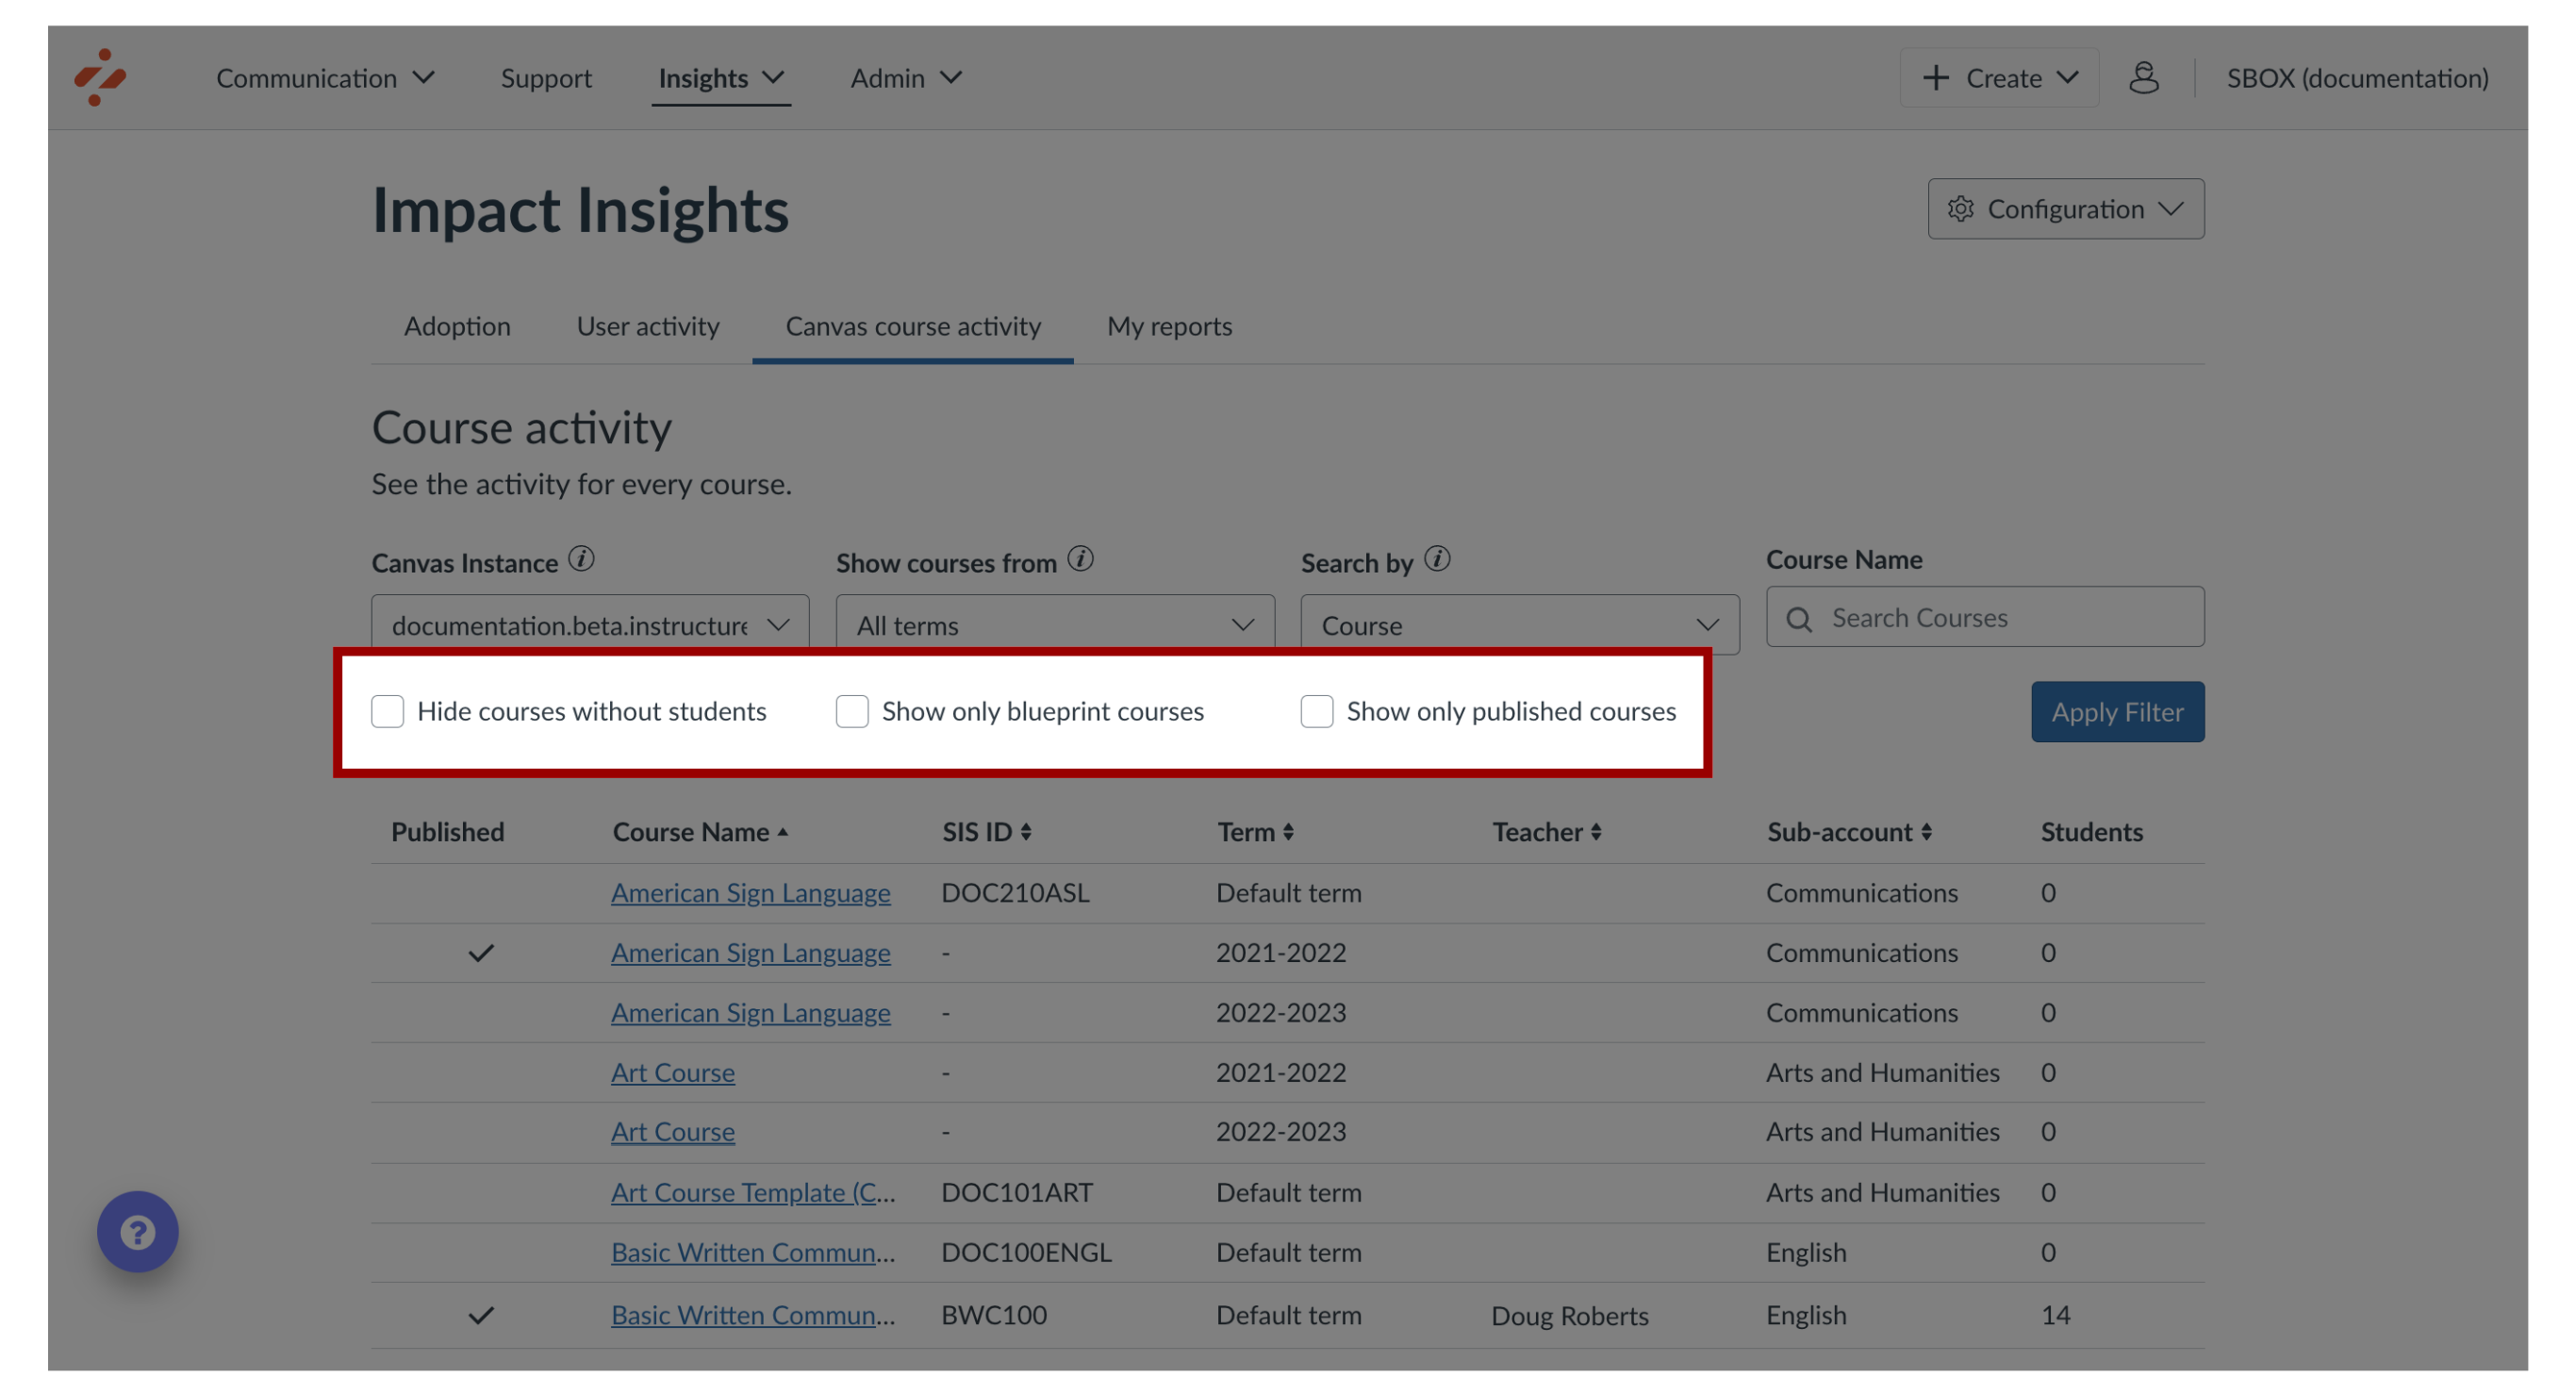
8. Other Options
To hide students from showing, click the Hide courses without students checkbox.
To show only blueprint courses, click the Show only blueprint courses checkbox.
To show only published courses, click the Show only published courses checkbox.
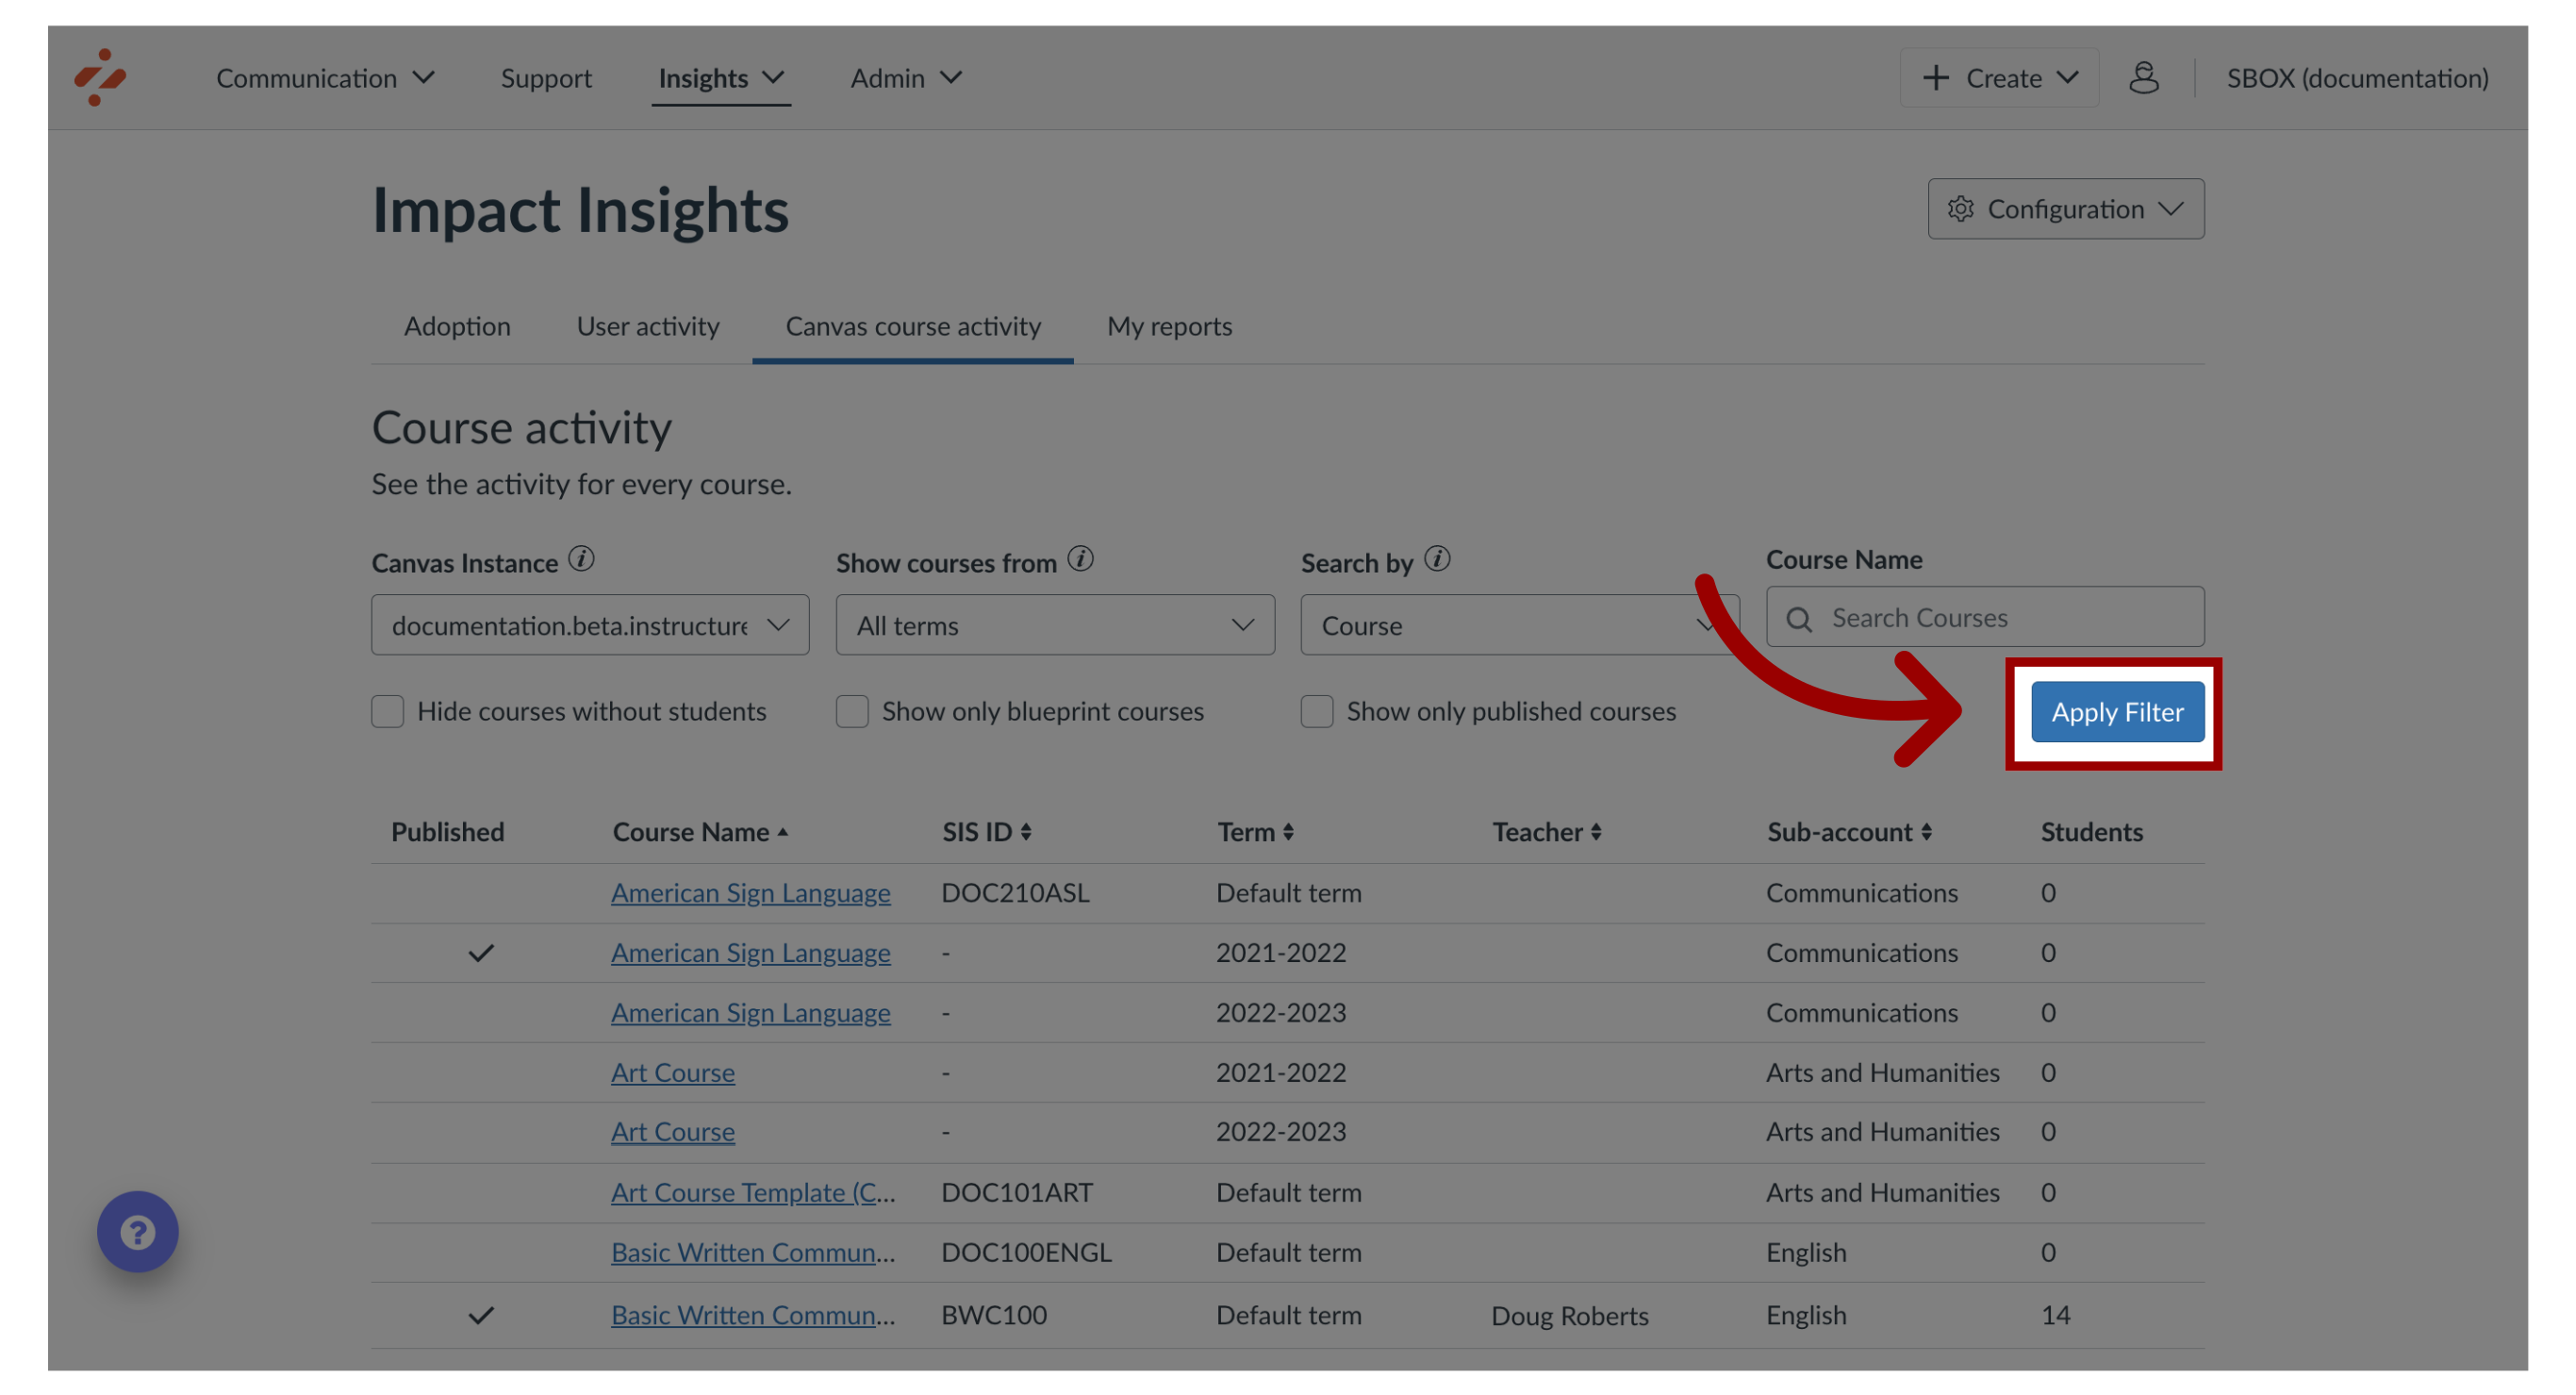
9. Apply Filters
Click the Apply Filter button.
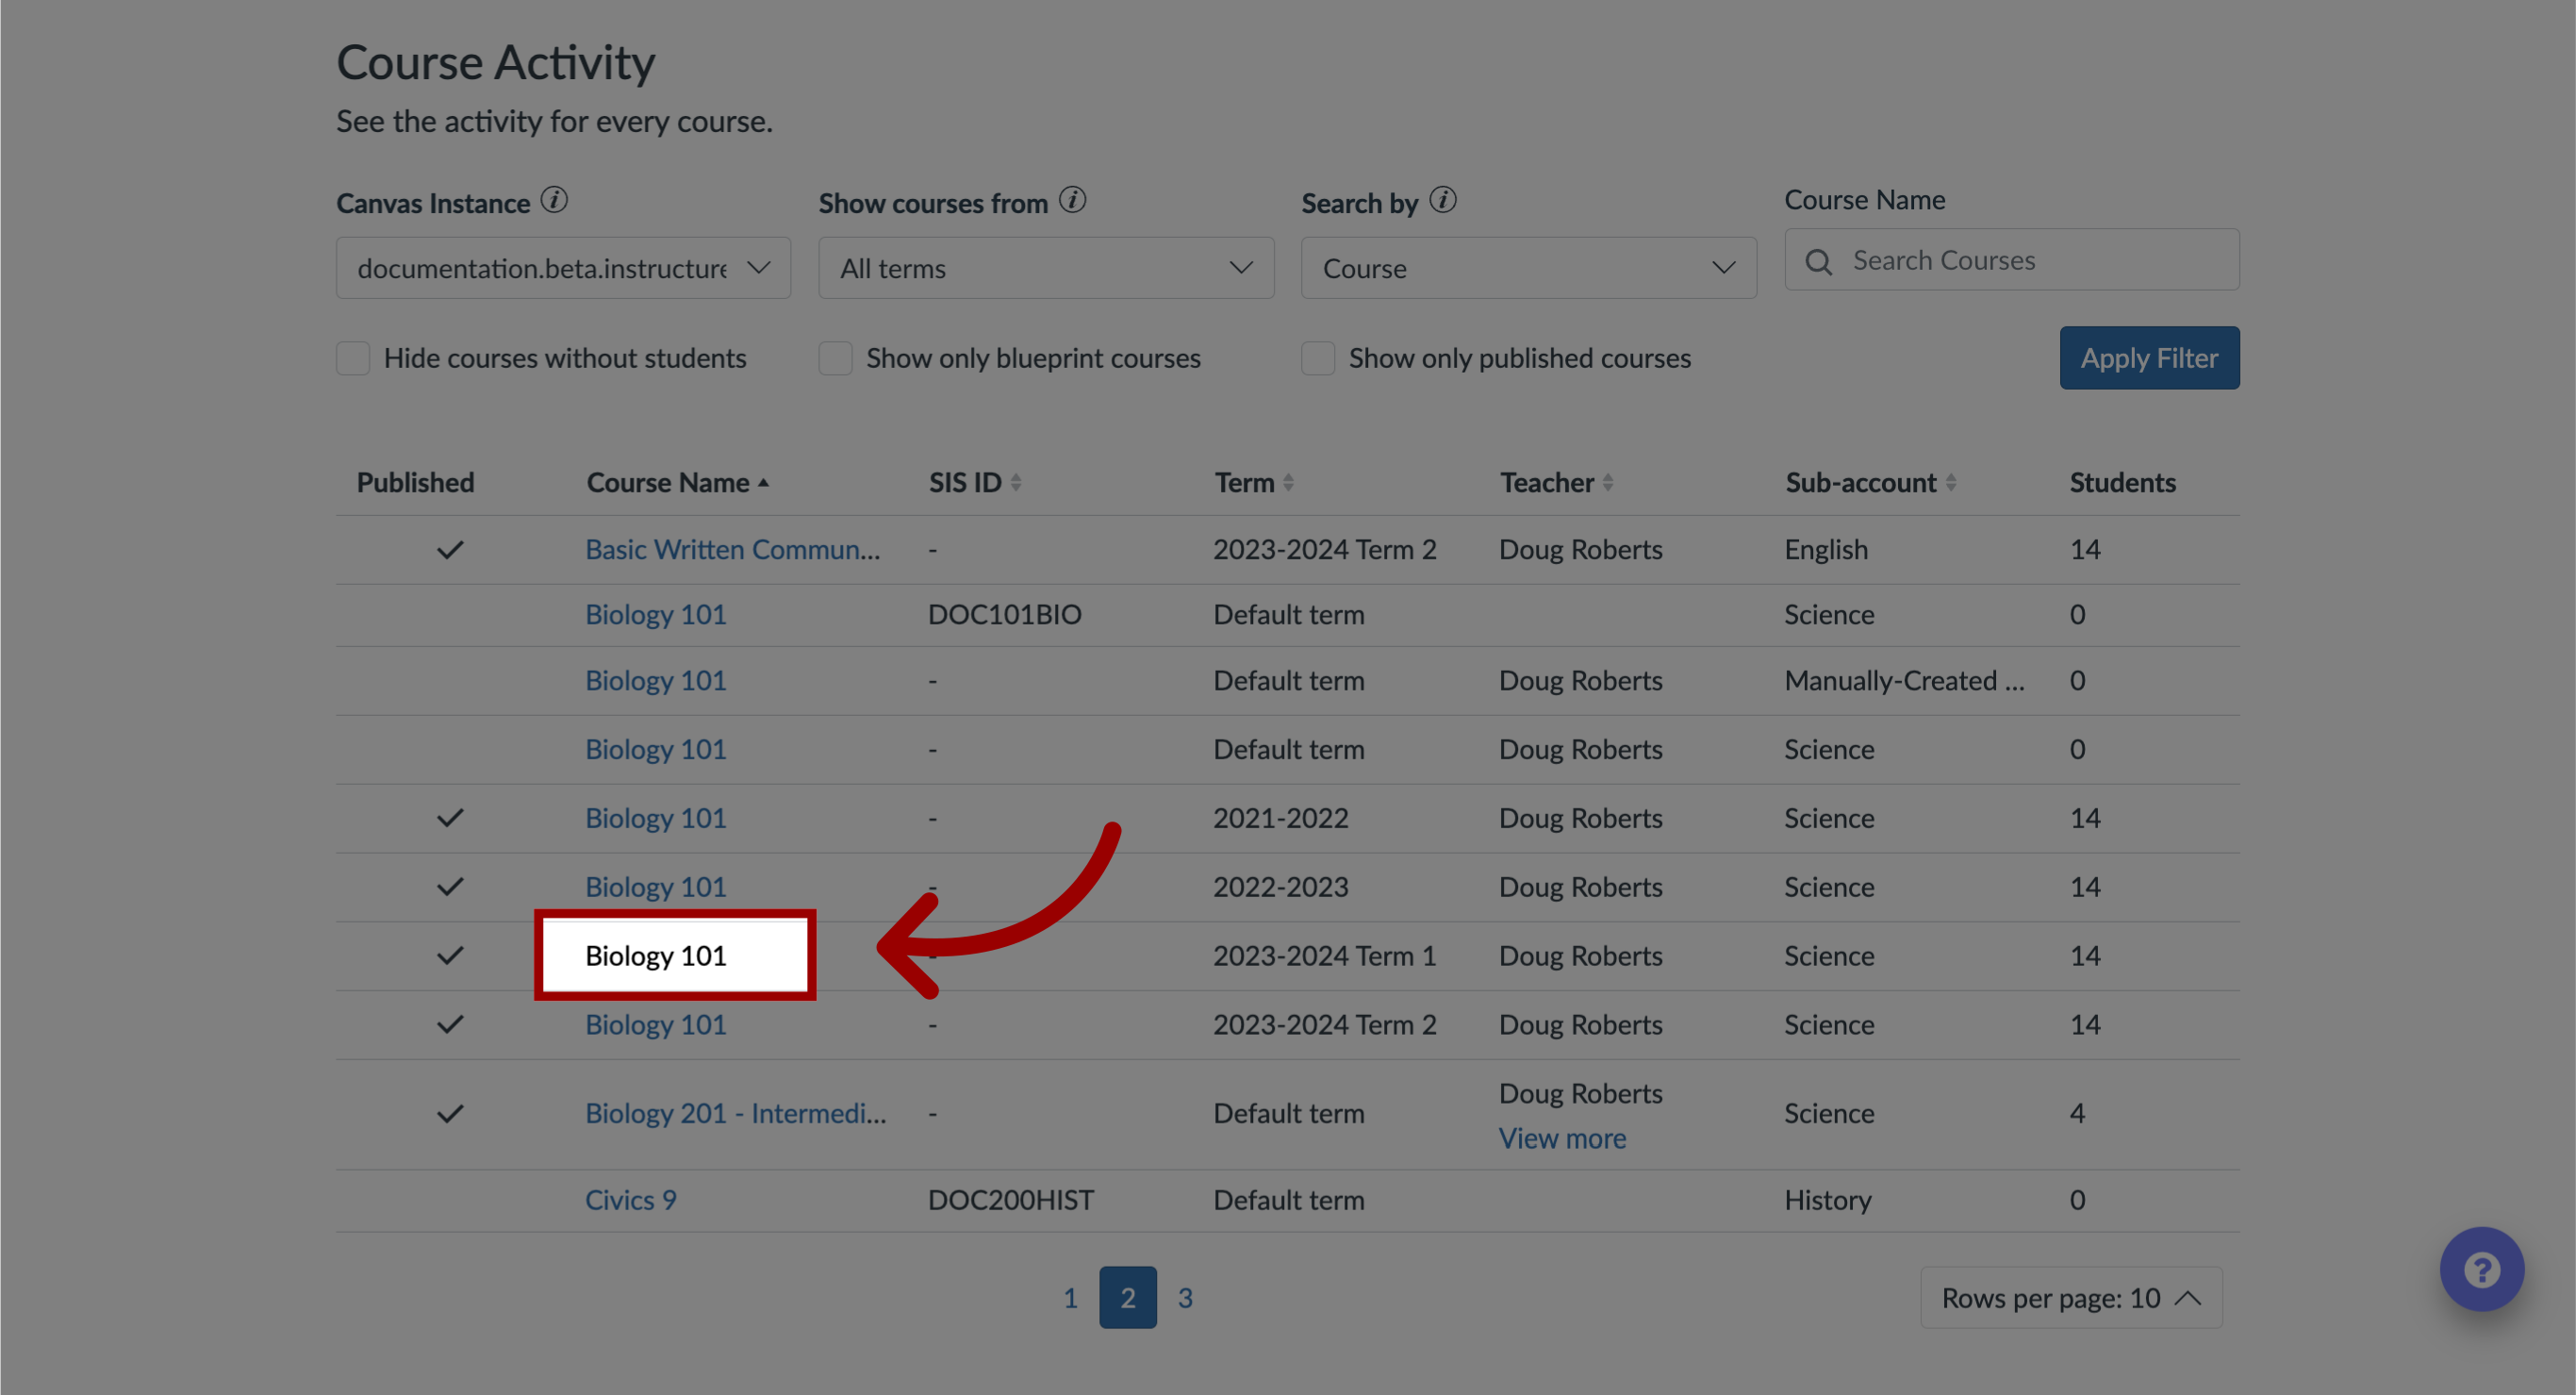
10. Open Course
Locate and click the course name you would like to view the Course Activity information.
11. Filter Date Range
To modify the date range for the course, select the Start Date and End Date by clicking the Calendar icon.
Then, click the Apply button.
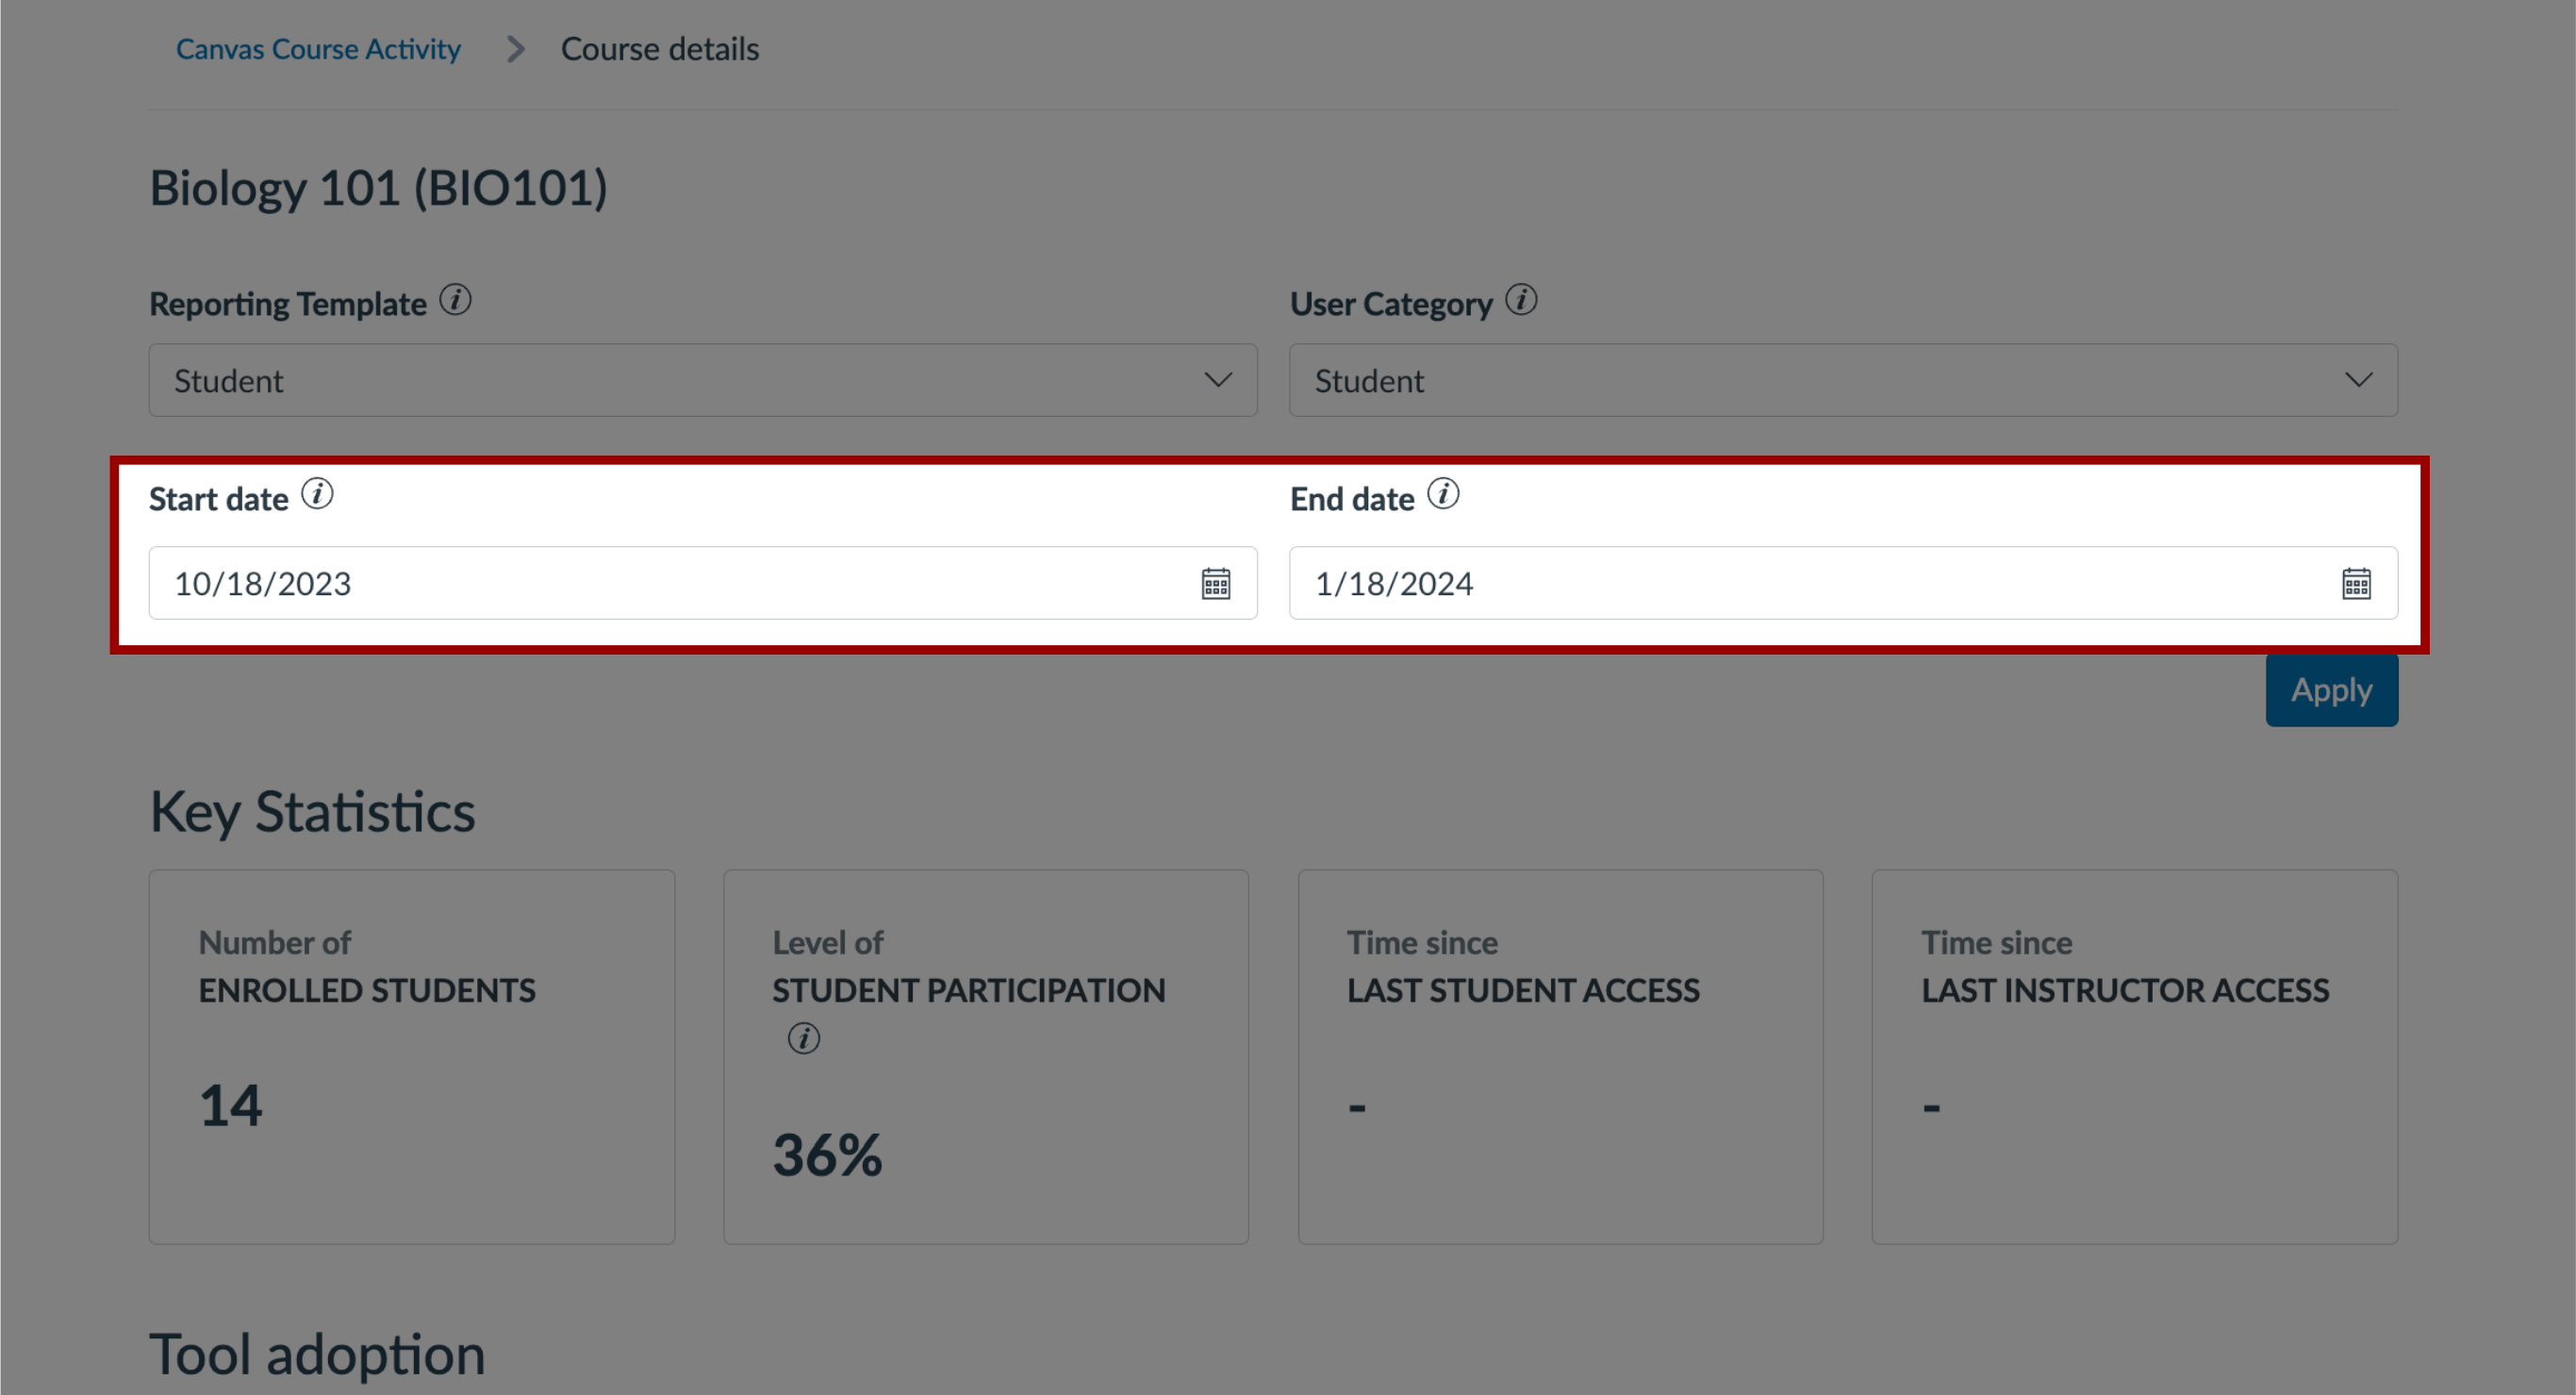
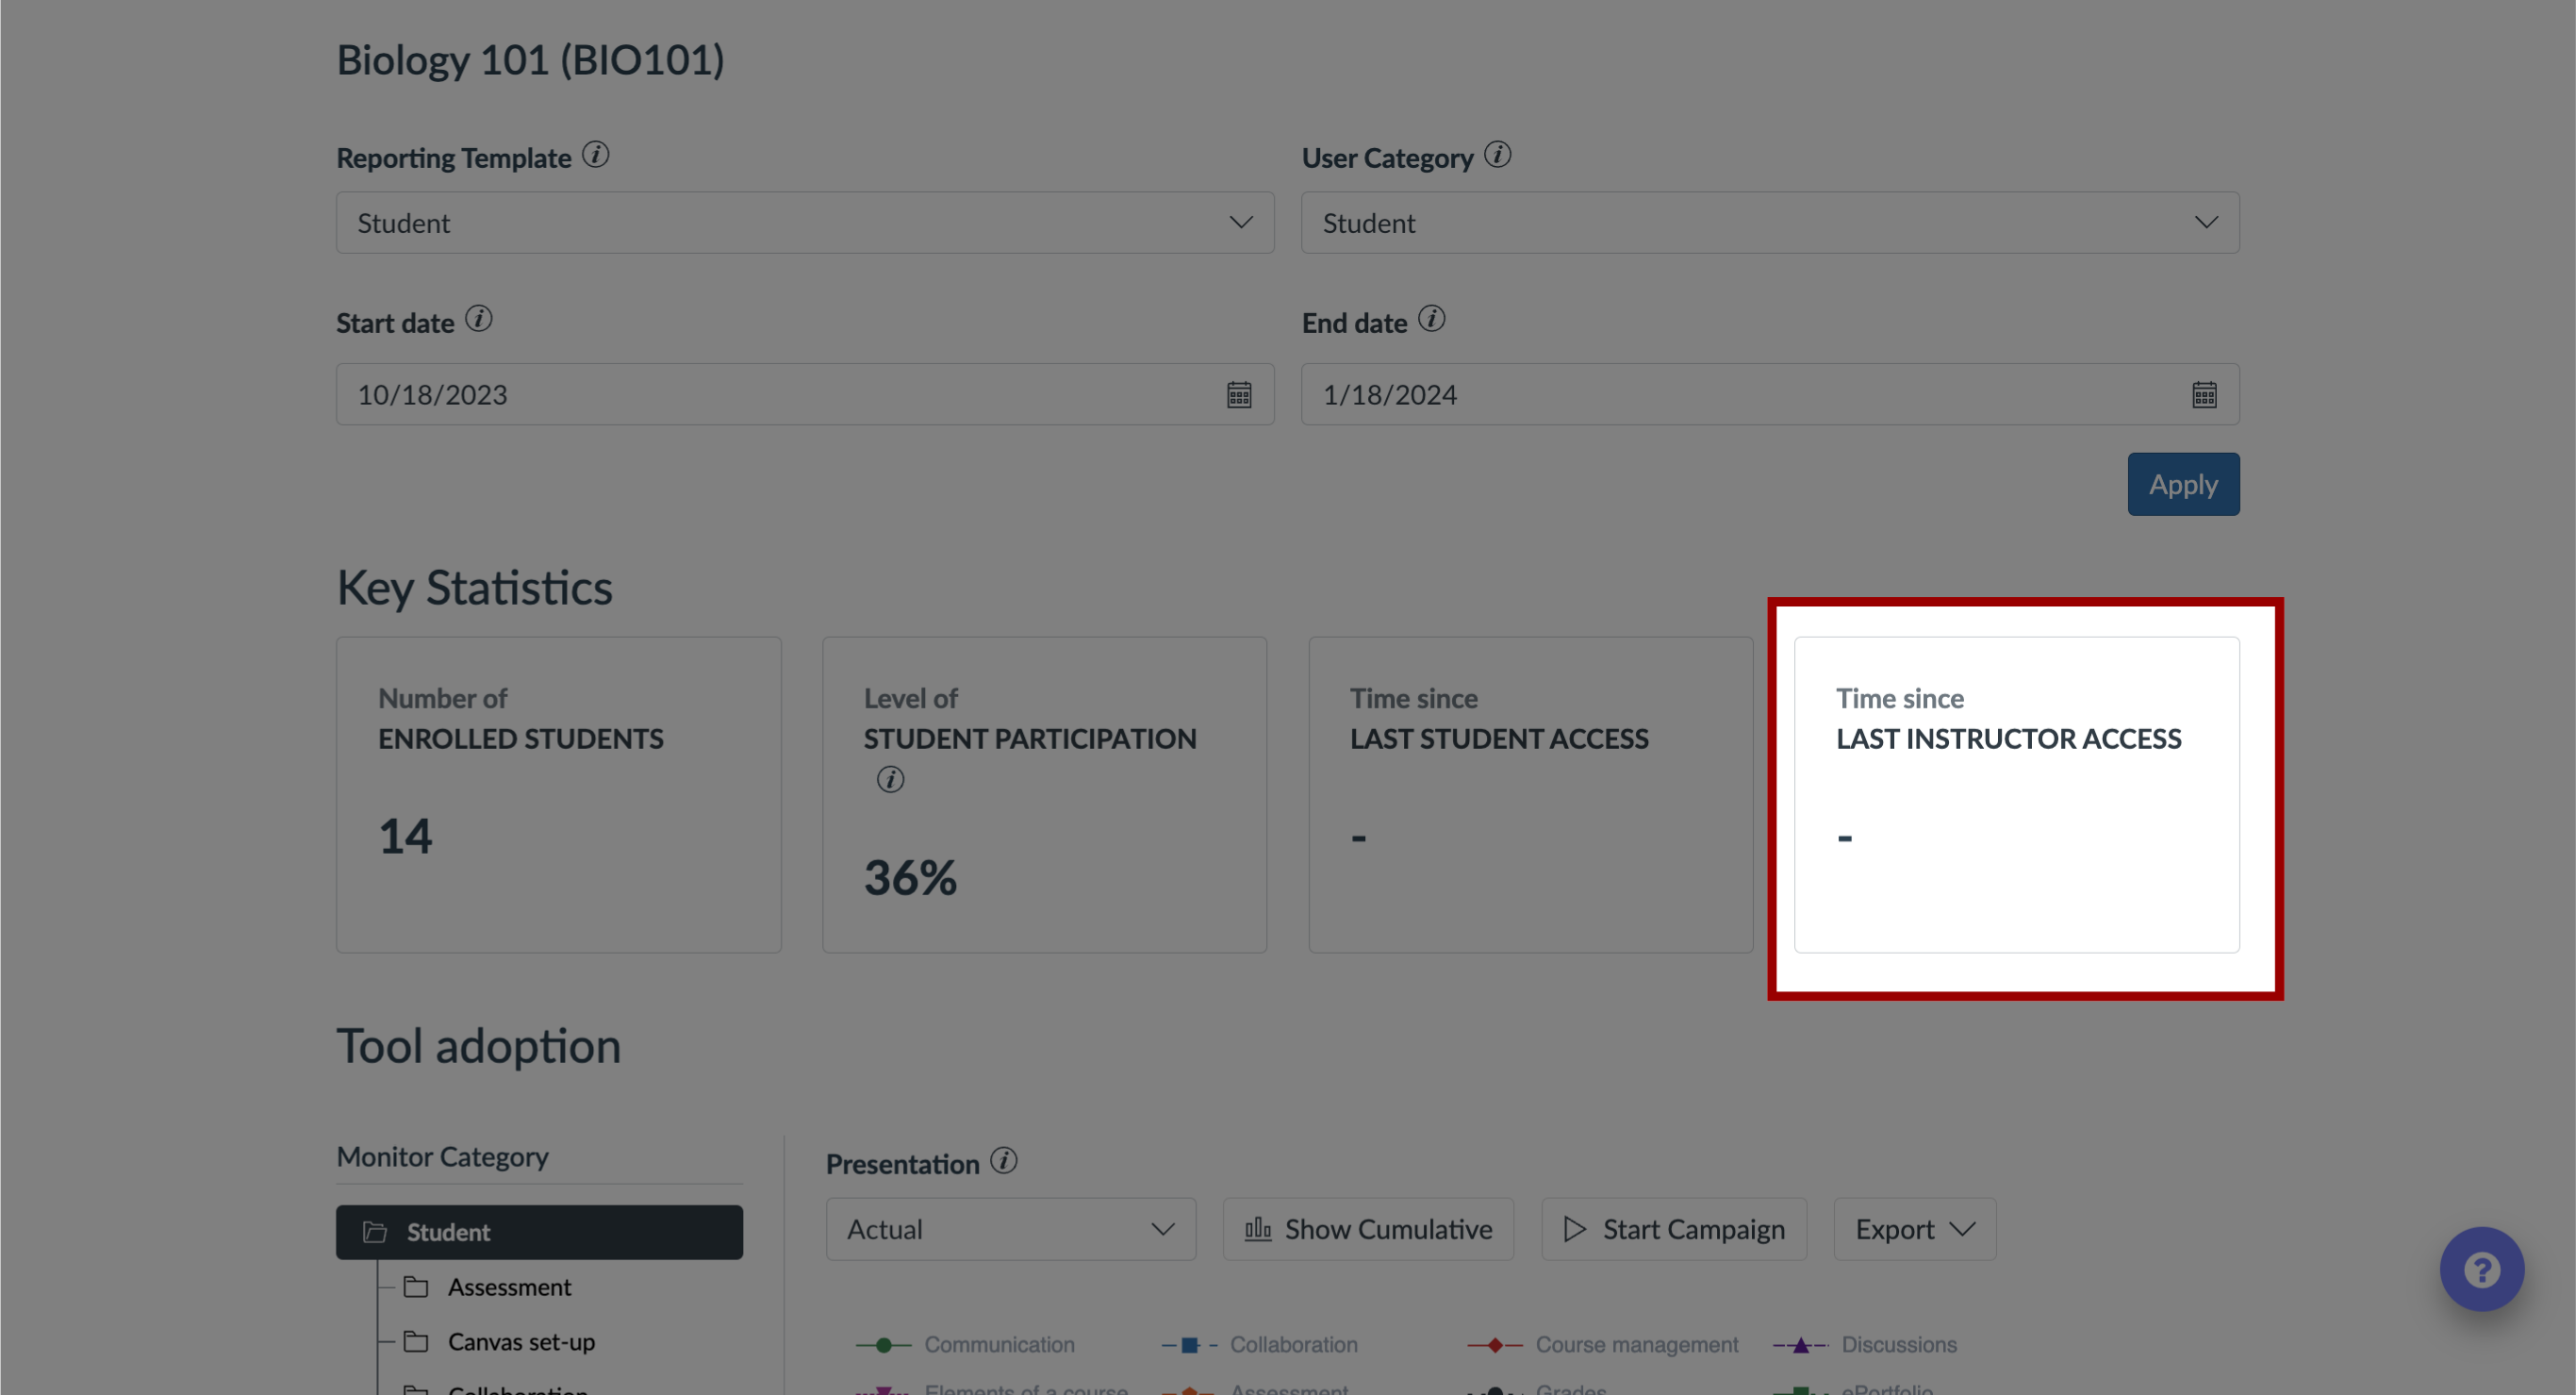
12. Key Statistics
The Key Statistics section displays the following data:
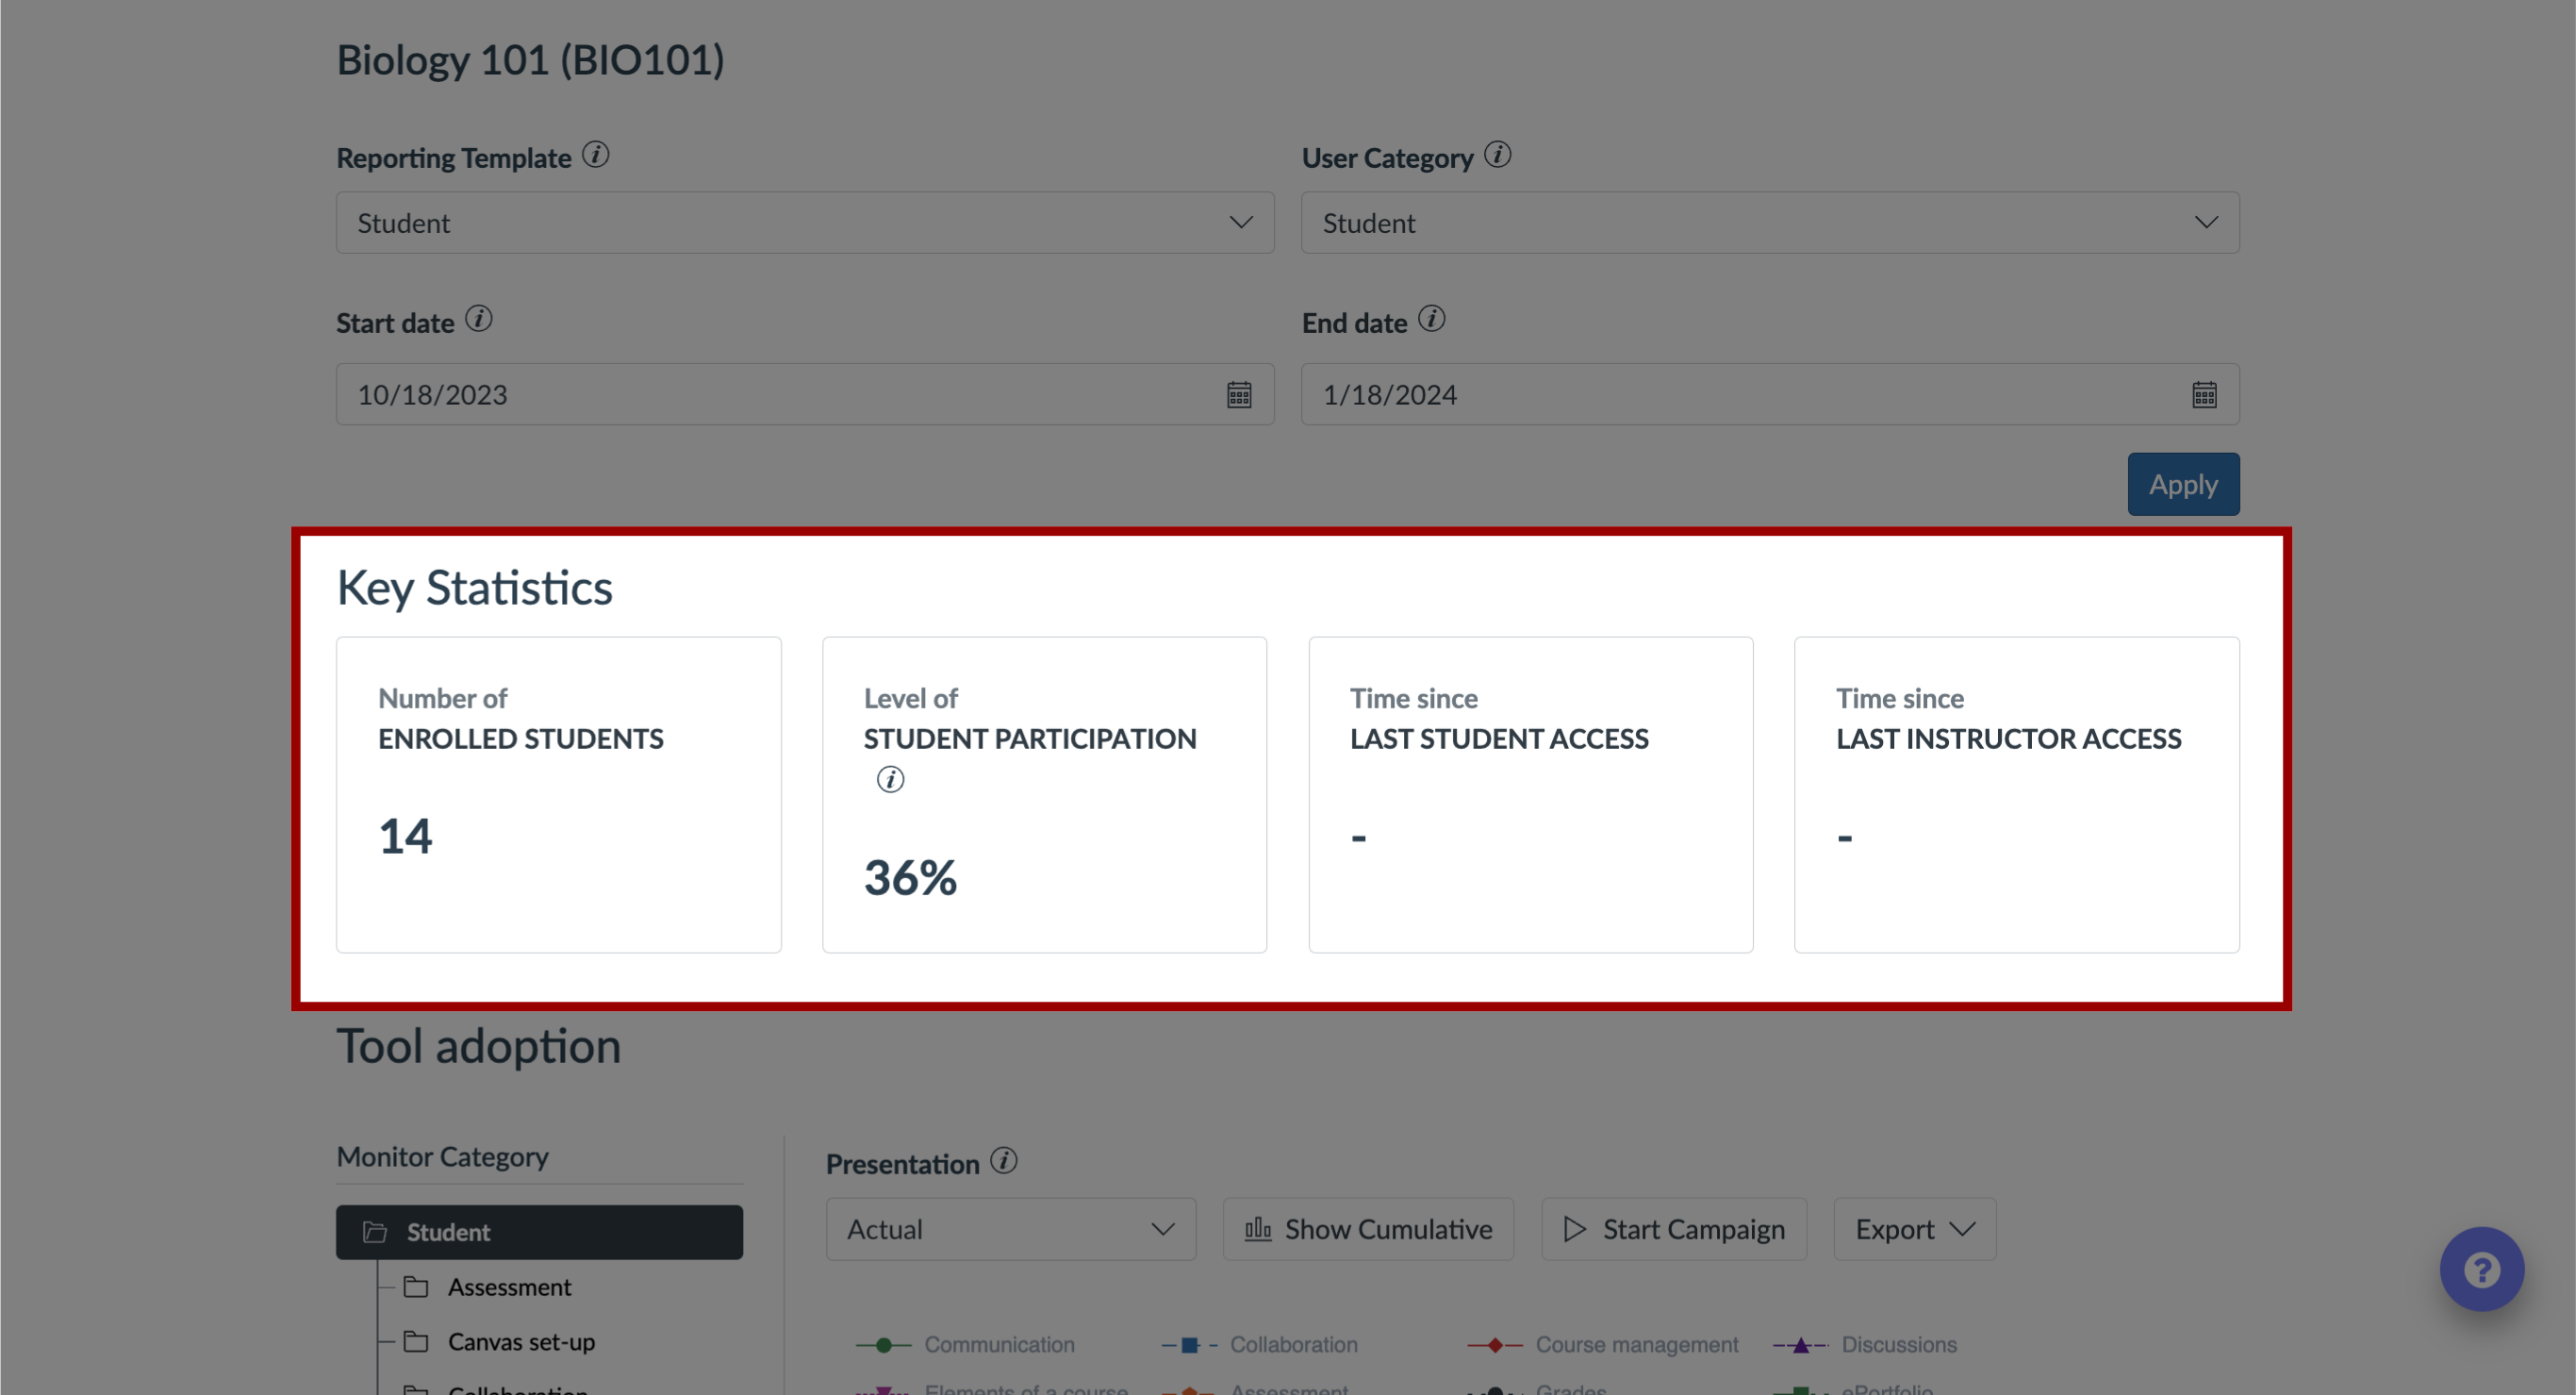
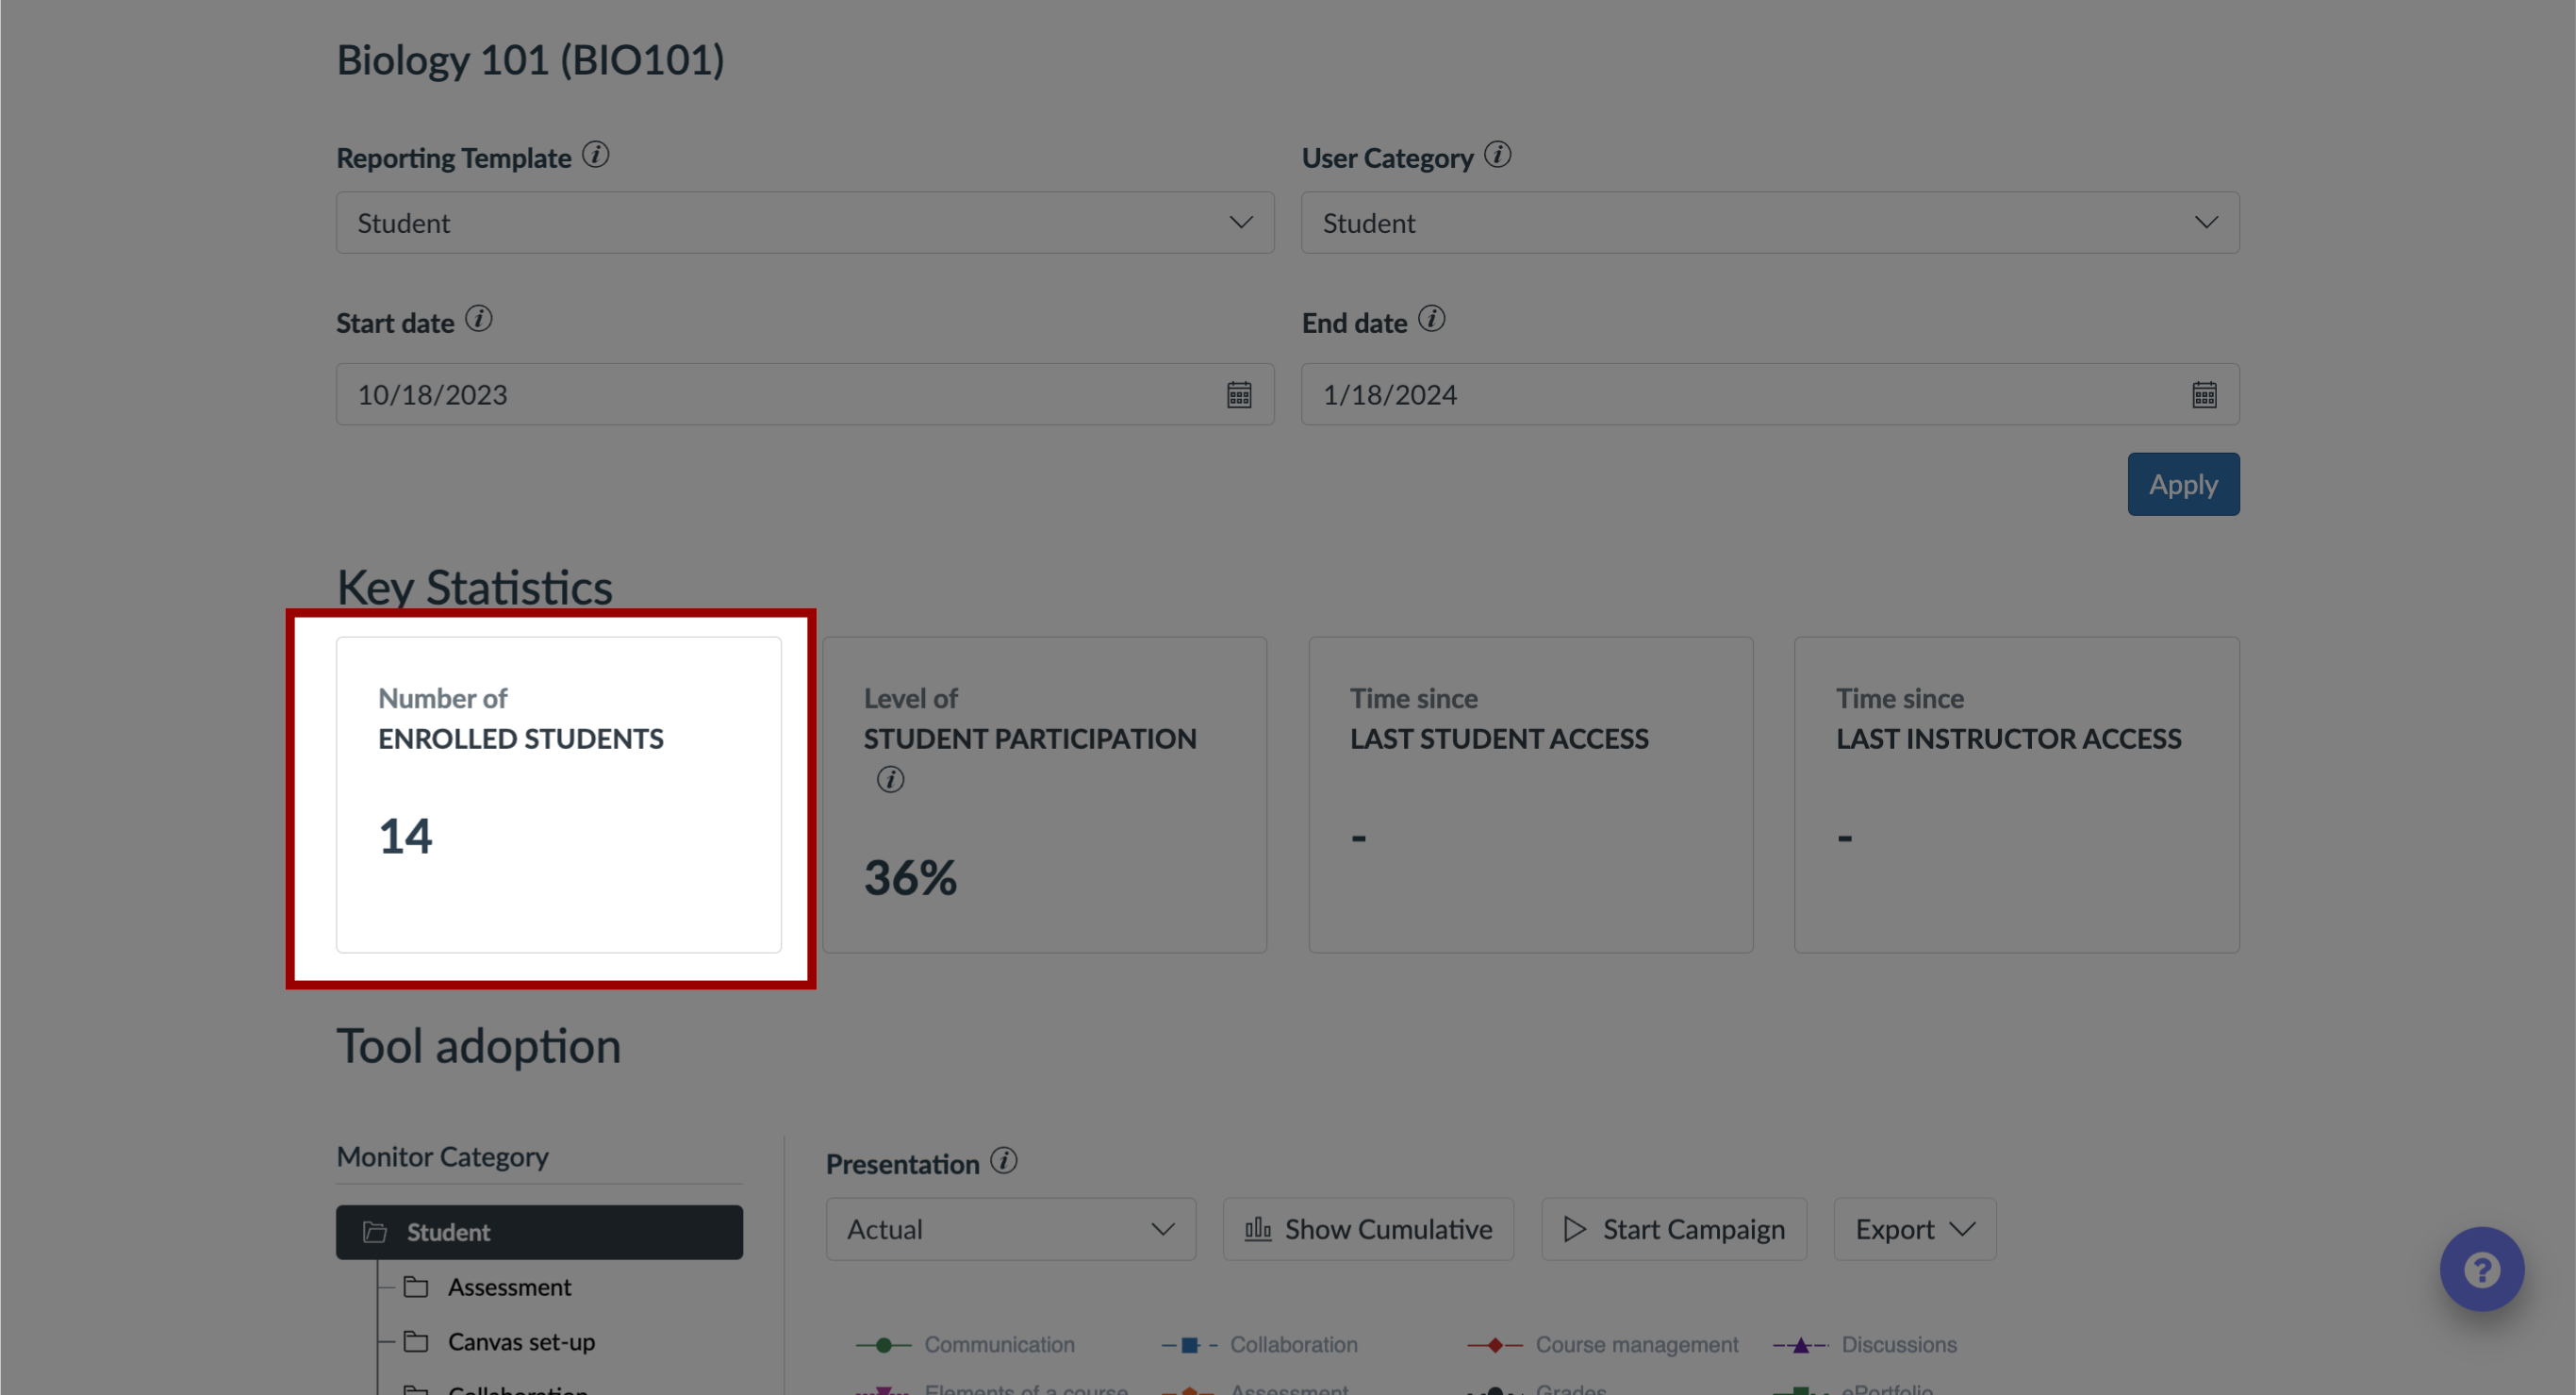
13. Enrolled Students
Number of Enrolled Students: shows the total number of students enrolled in the course.
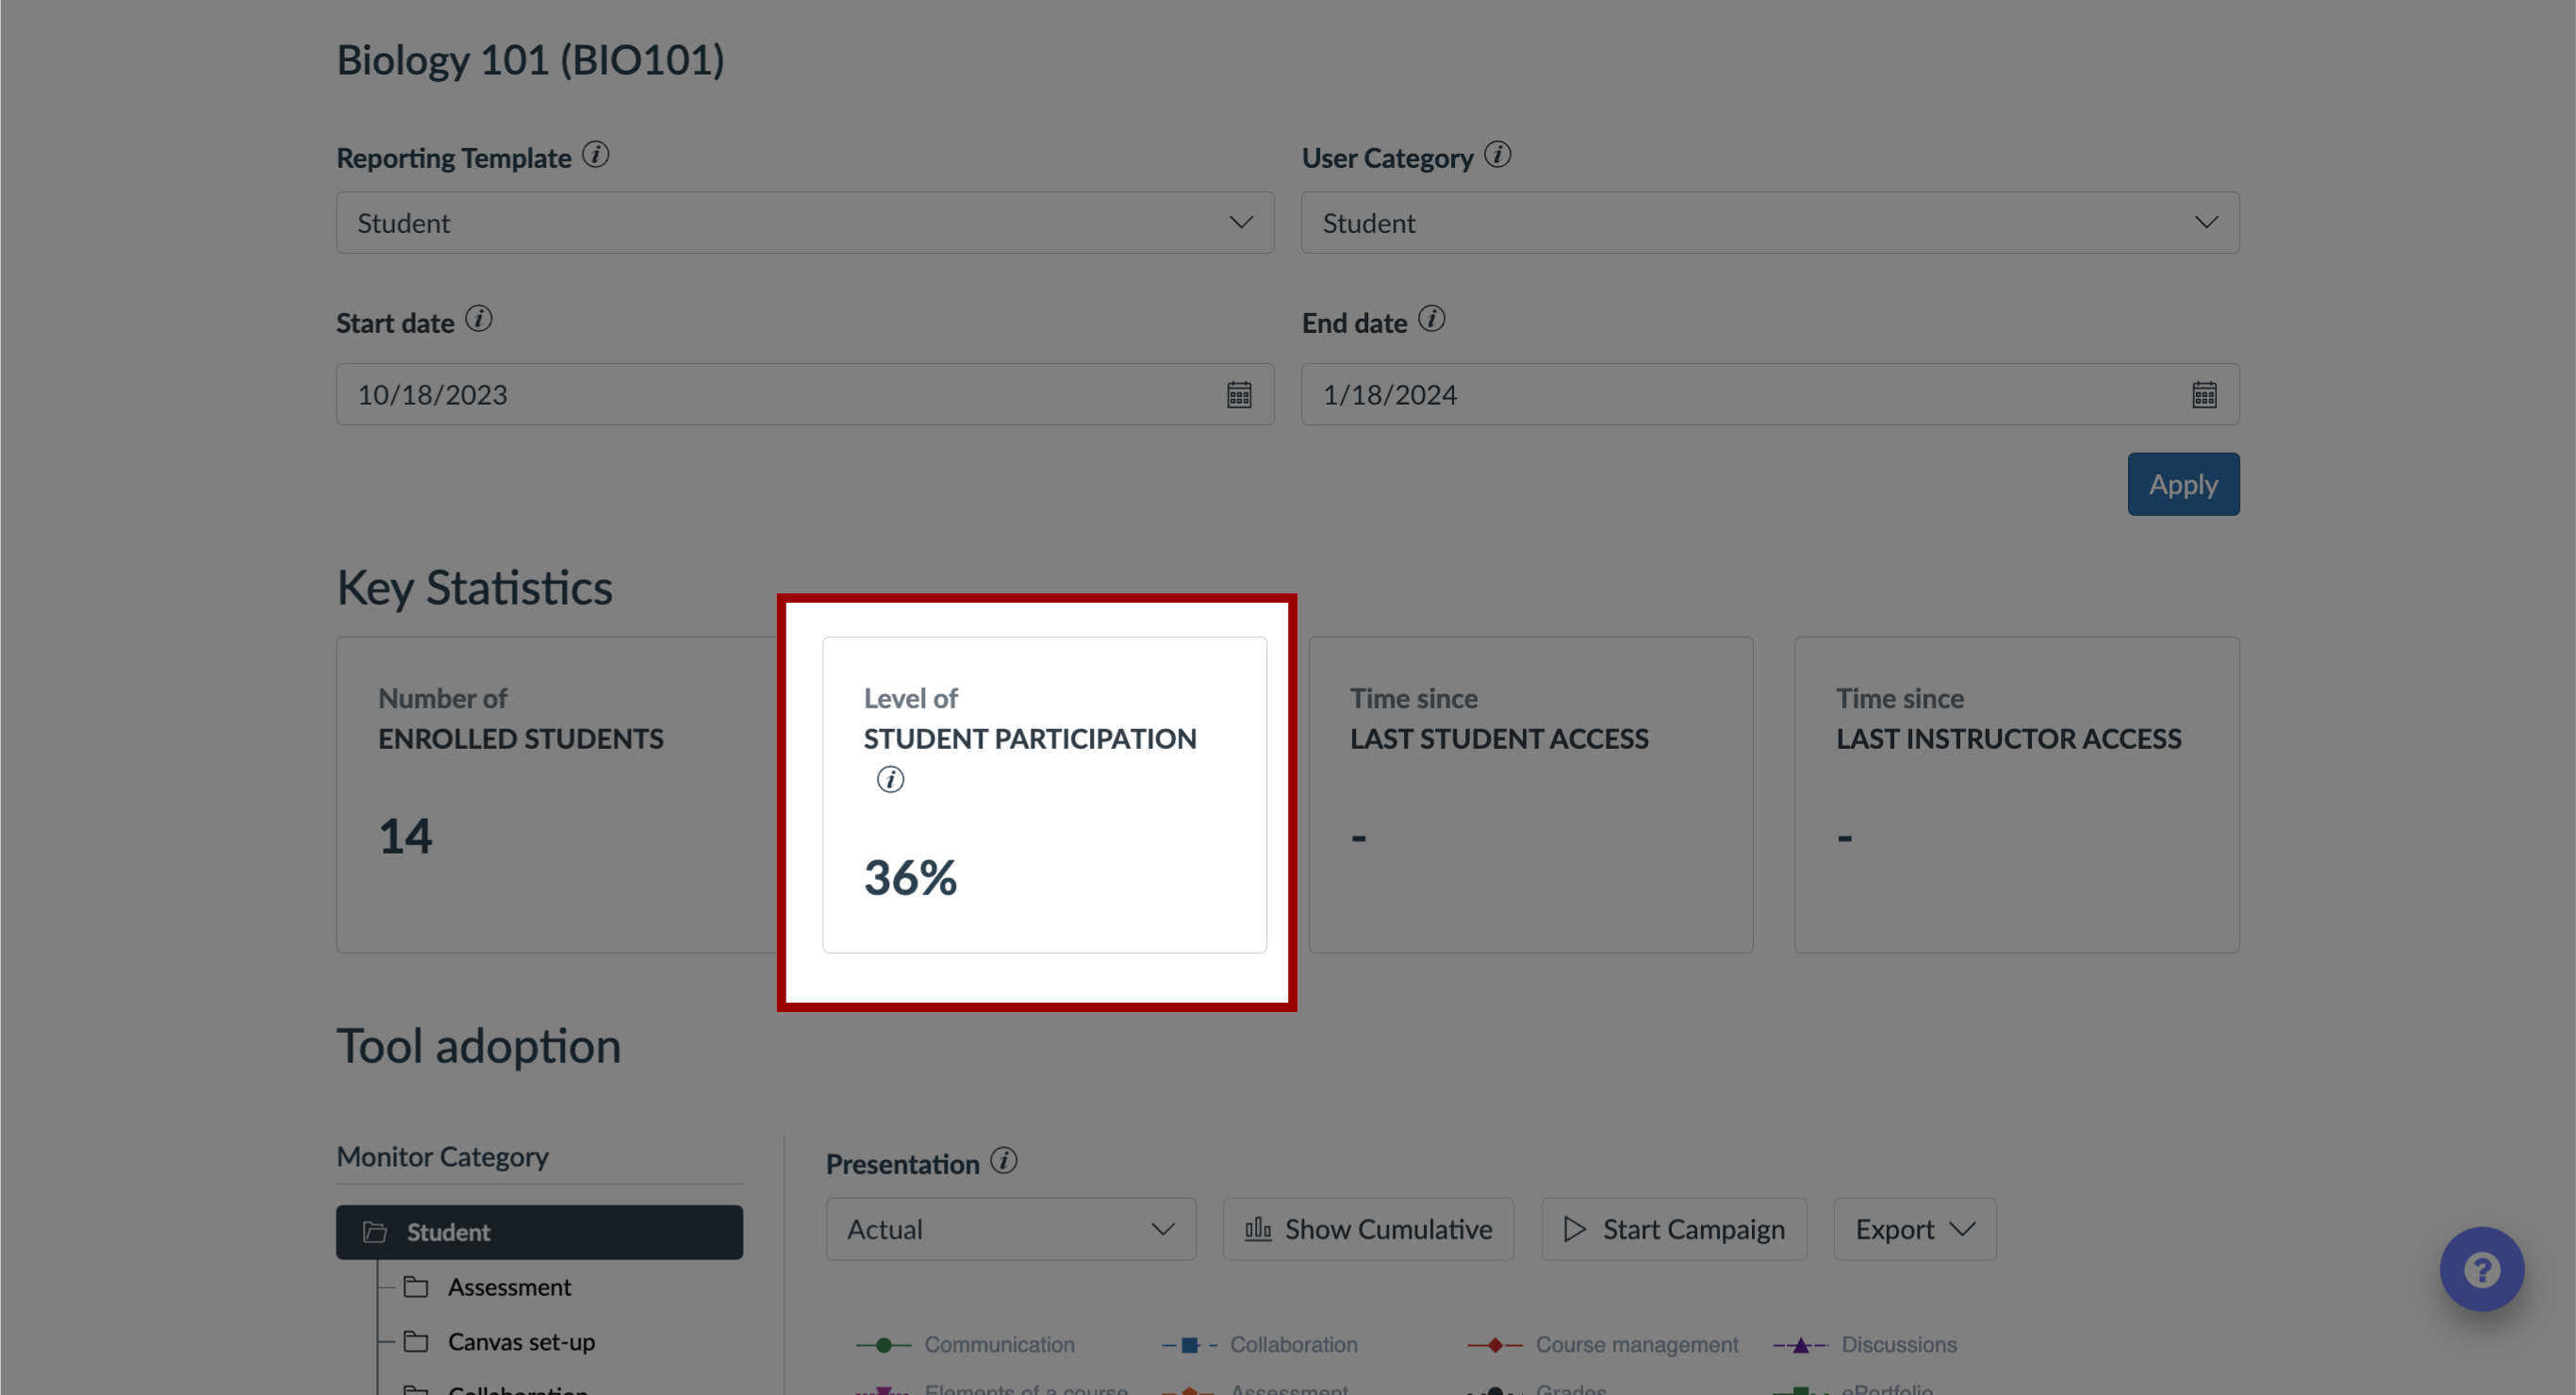
14. Student Participation
Level of Student Participation: displays the percentage of the enrolled students that have accessed the course.
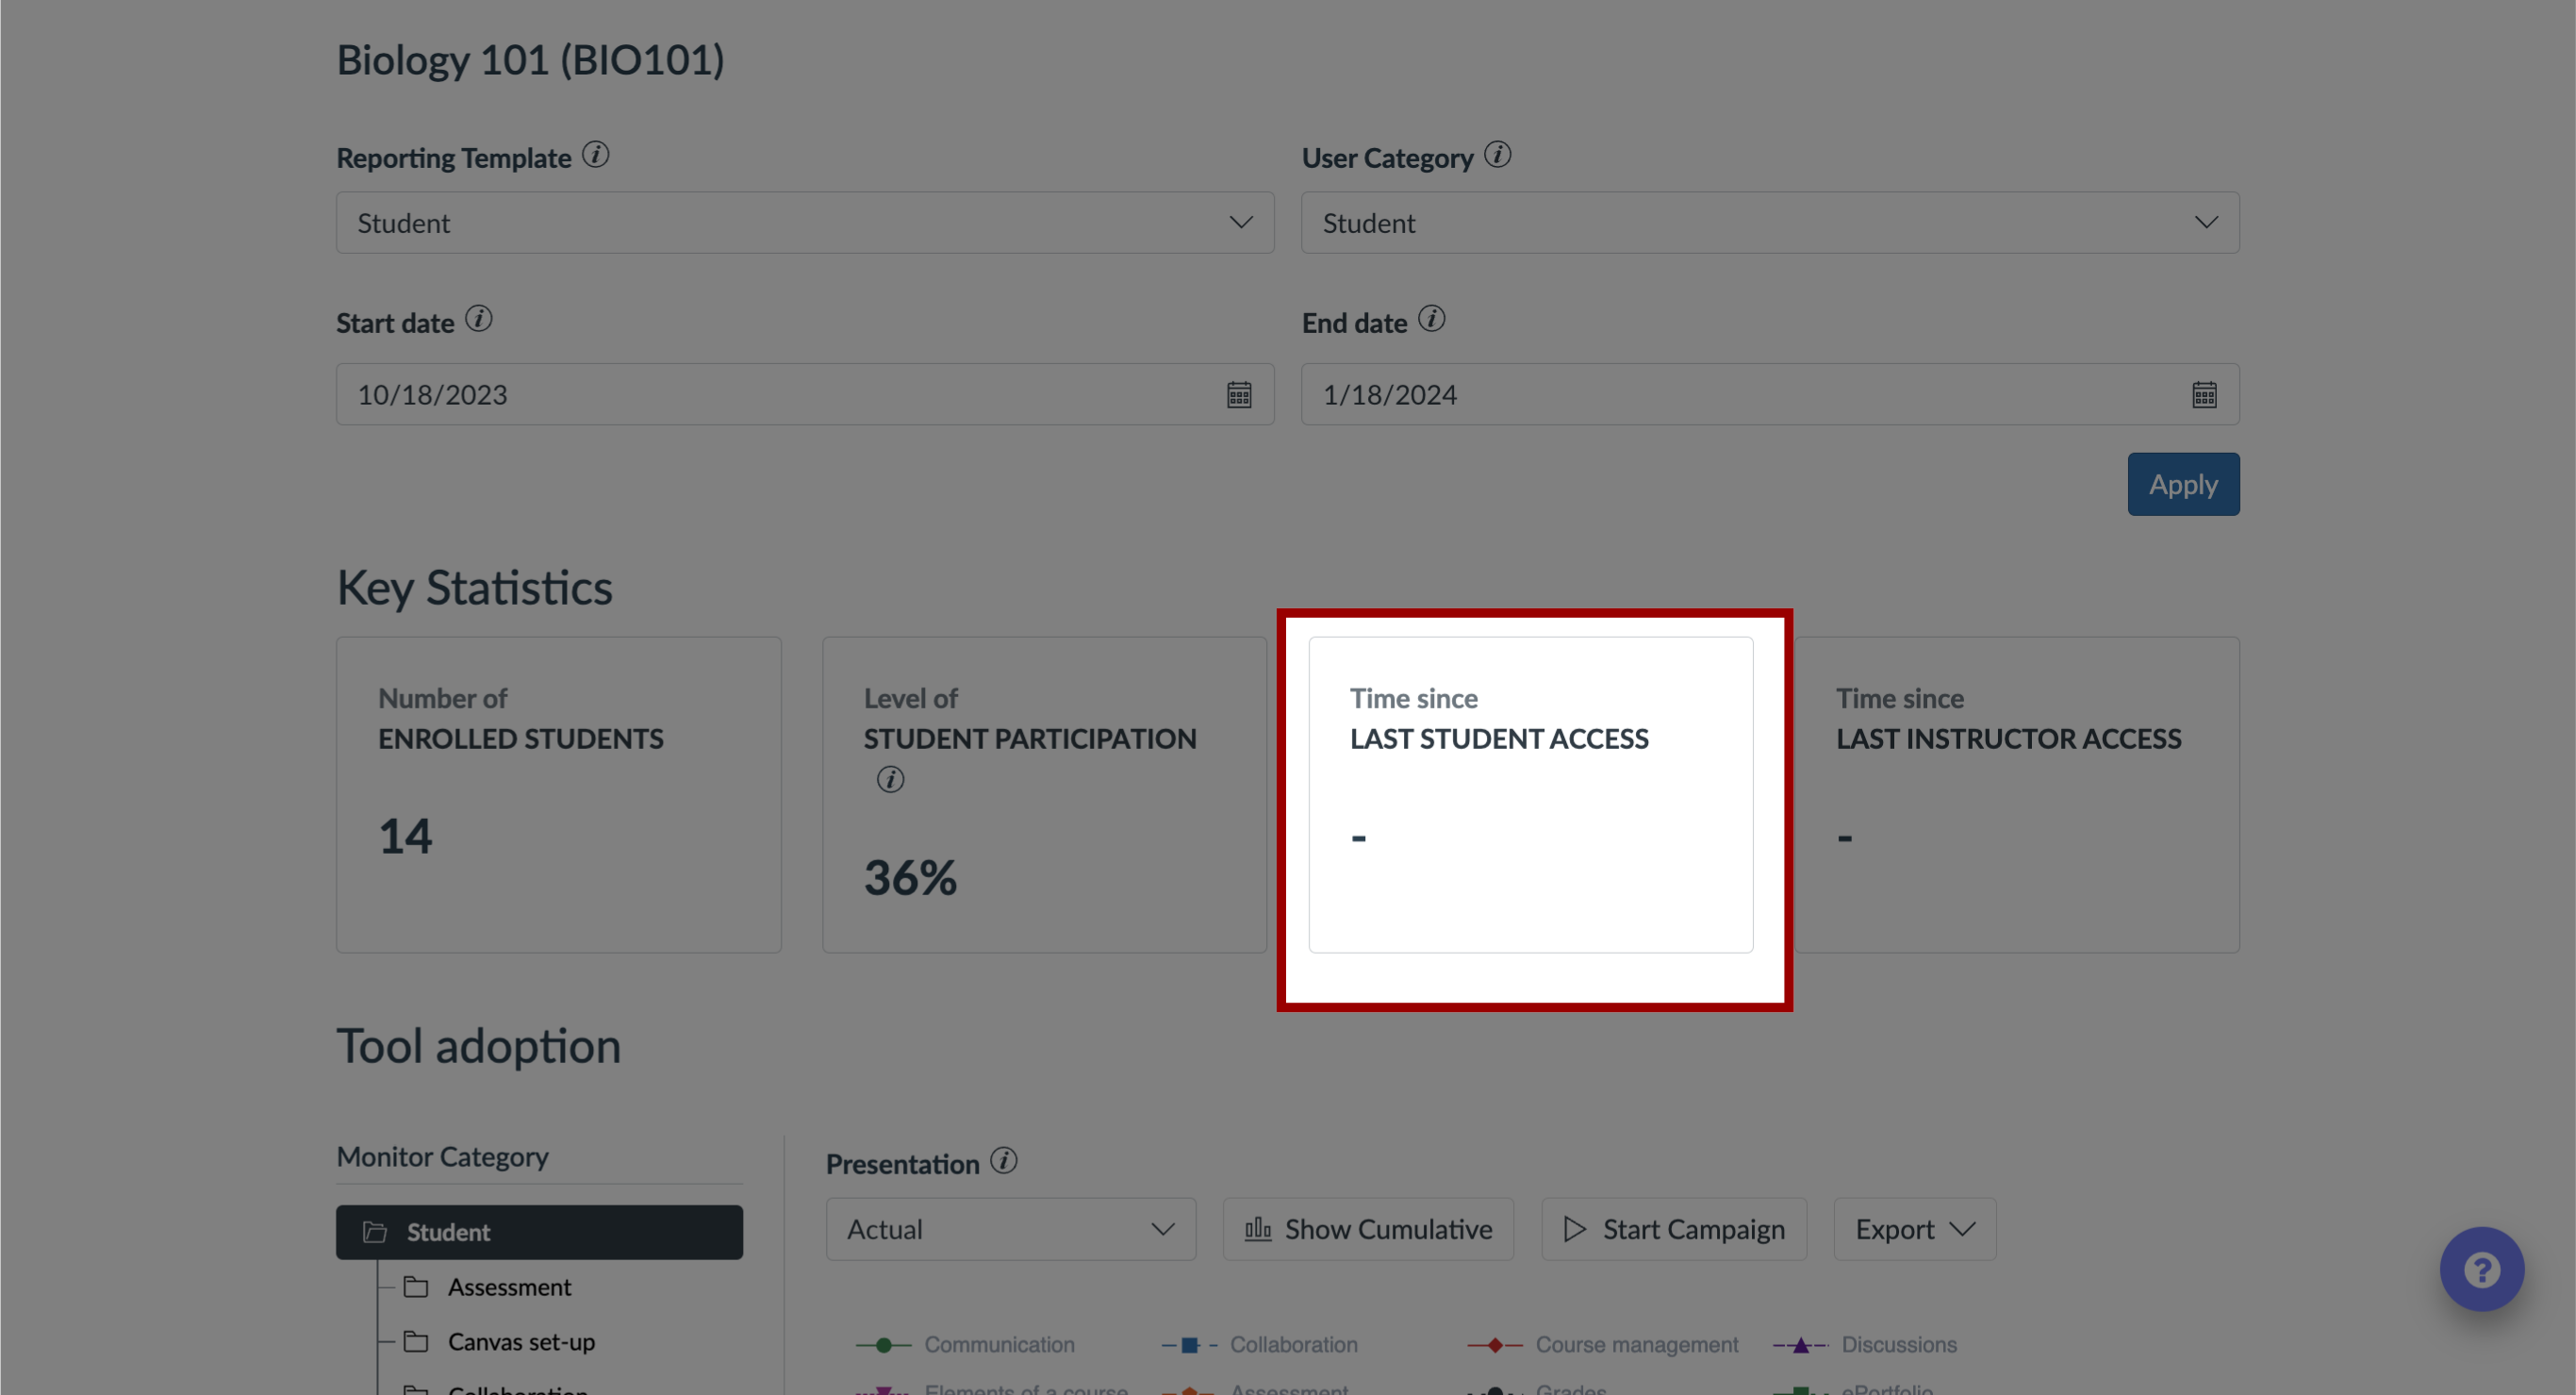
15. Last Student Access
Time Since Last Student Access: displays the number of days since the last student access.
16. Last Instructor Access
Time Since Last Instructor Access: displays the number of days since the last instructor access.
17. Tool Adoption: Monitor Category
Select the Monitor Category to view all of the monitors in each category.

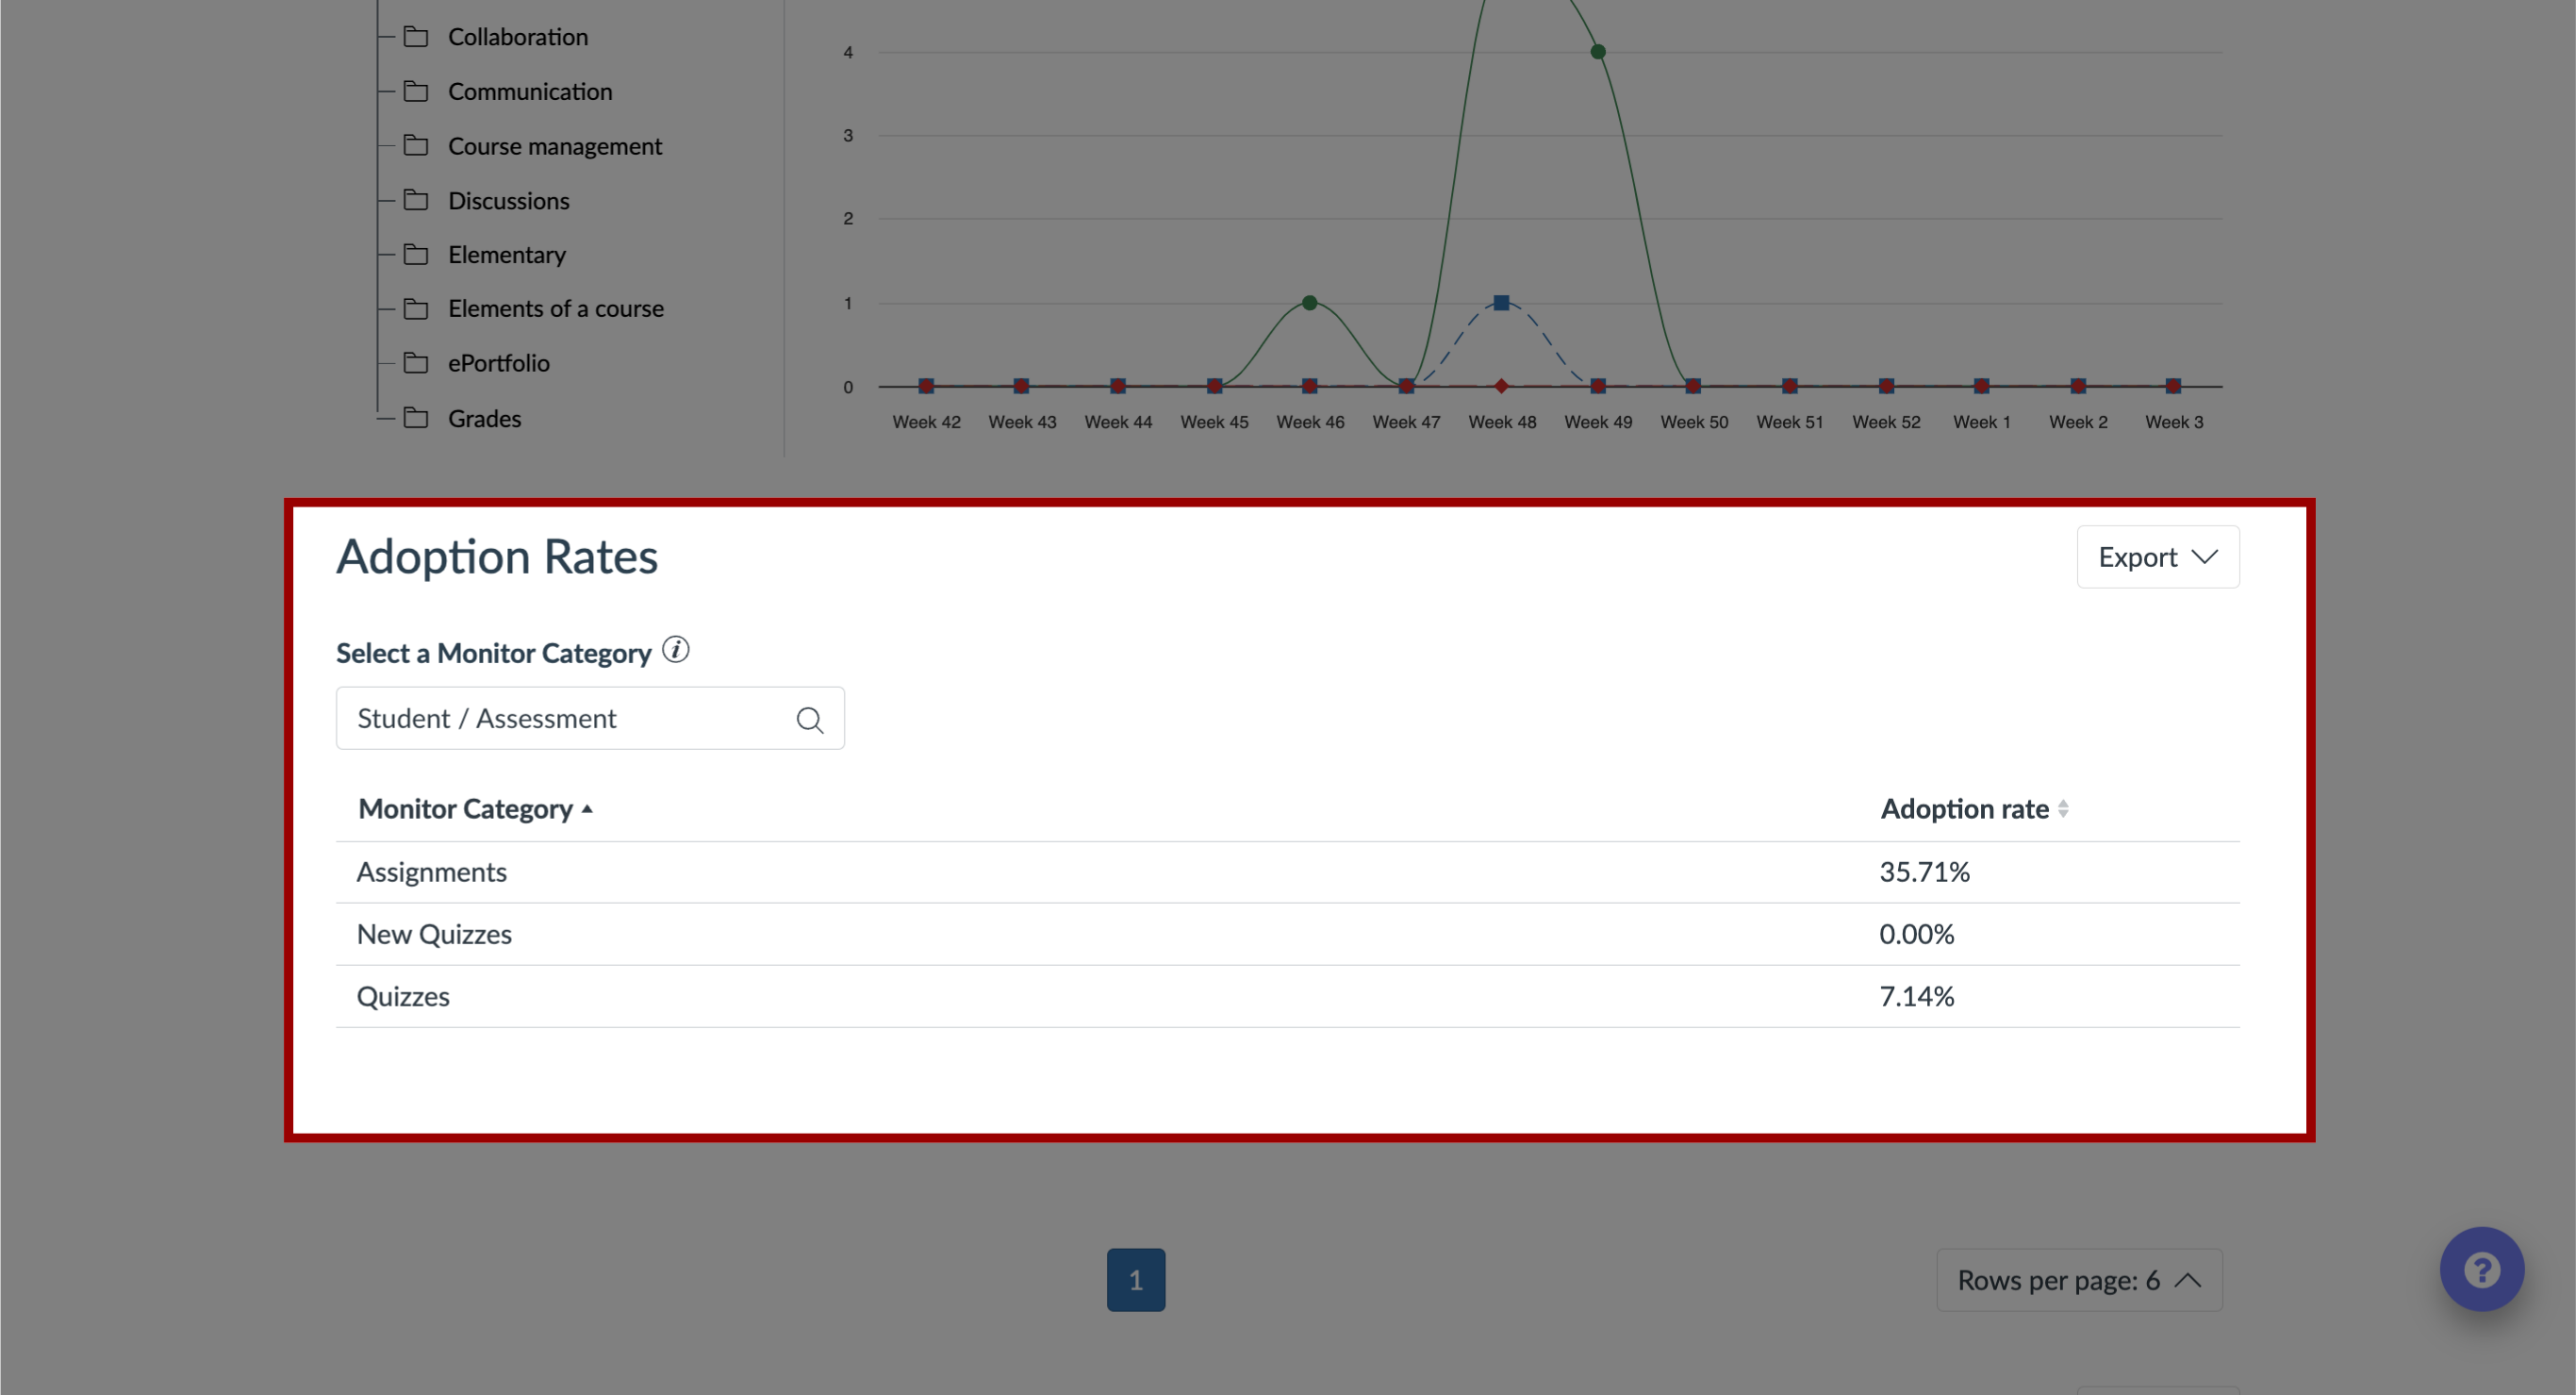
18. Adoption Rates
The Monitor Category Adoption Levels are calculated based on the number of unique active users that have logged in to the learning application over the selected time period and how many of them have triggered the monitor category.
19. User Activity
For each student, the table displays the following data:
Name: name of the student
User ID: student user
ID Last Access: date users last accessed the course
Tool Groups: dynamic groups based on the selection in the
Reporting Template; these stats are relative to the dates selected in the Tool Adoption section.
To export the data, click the Export drop-down menu.
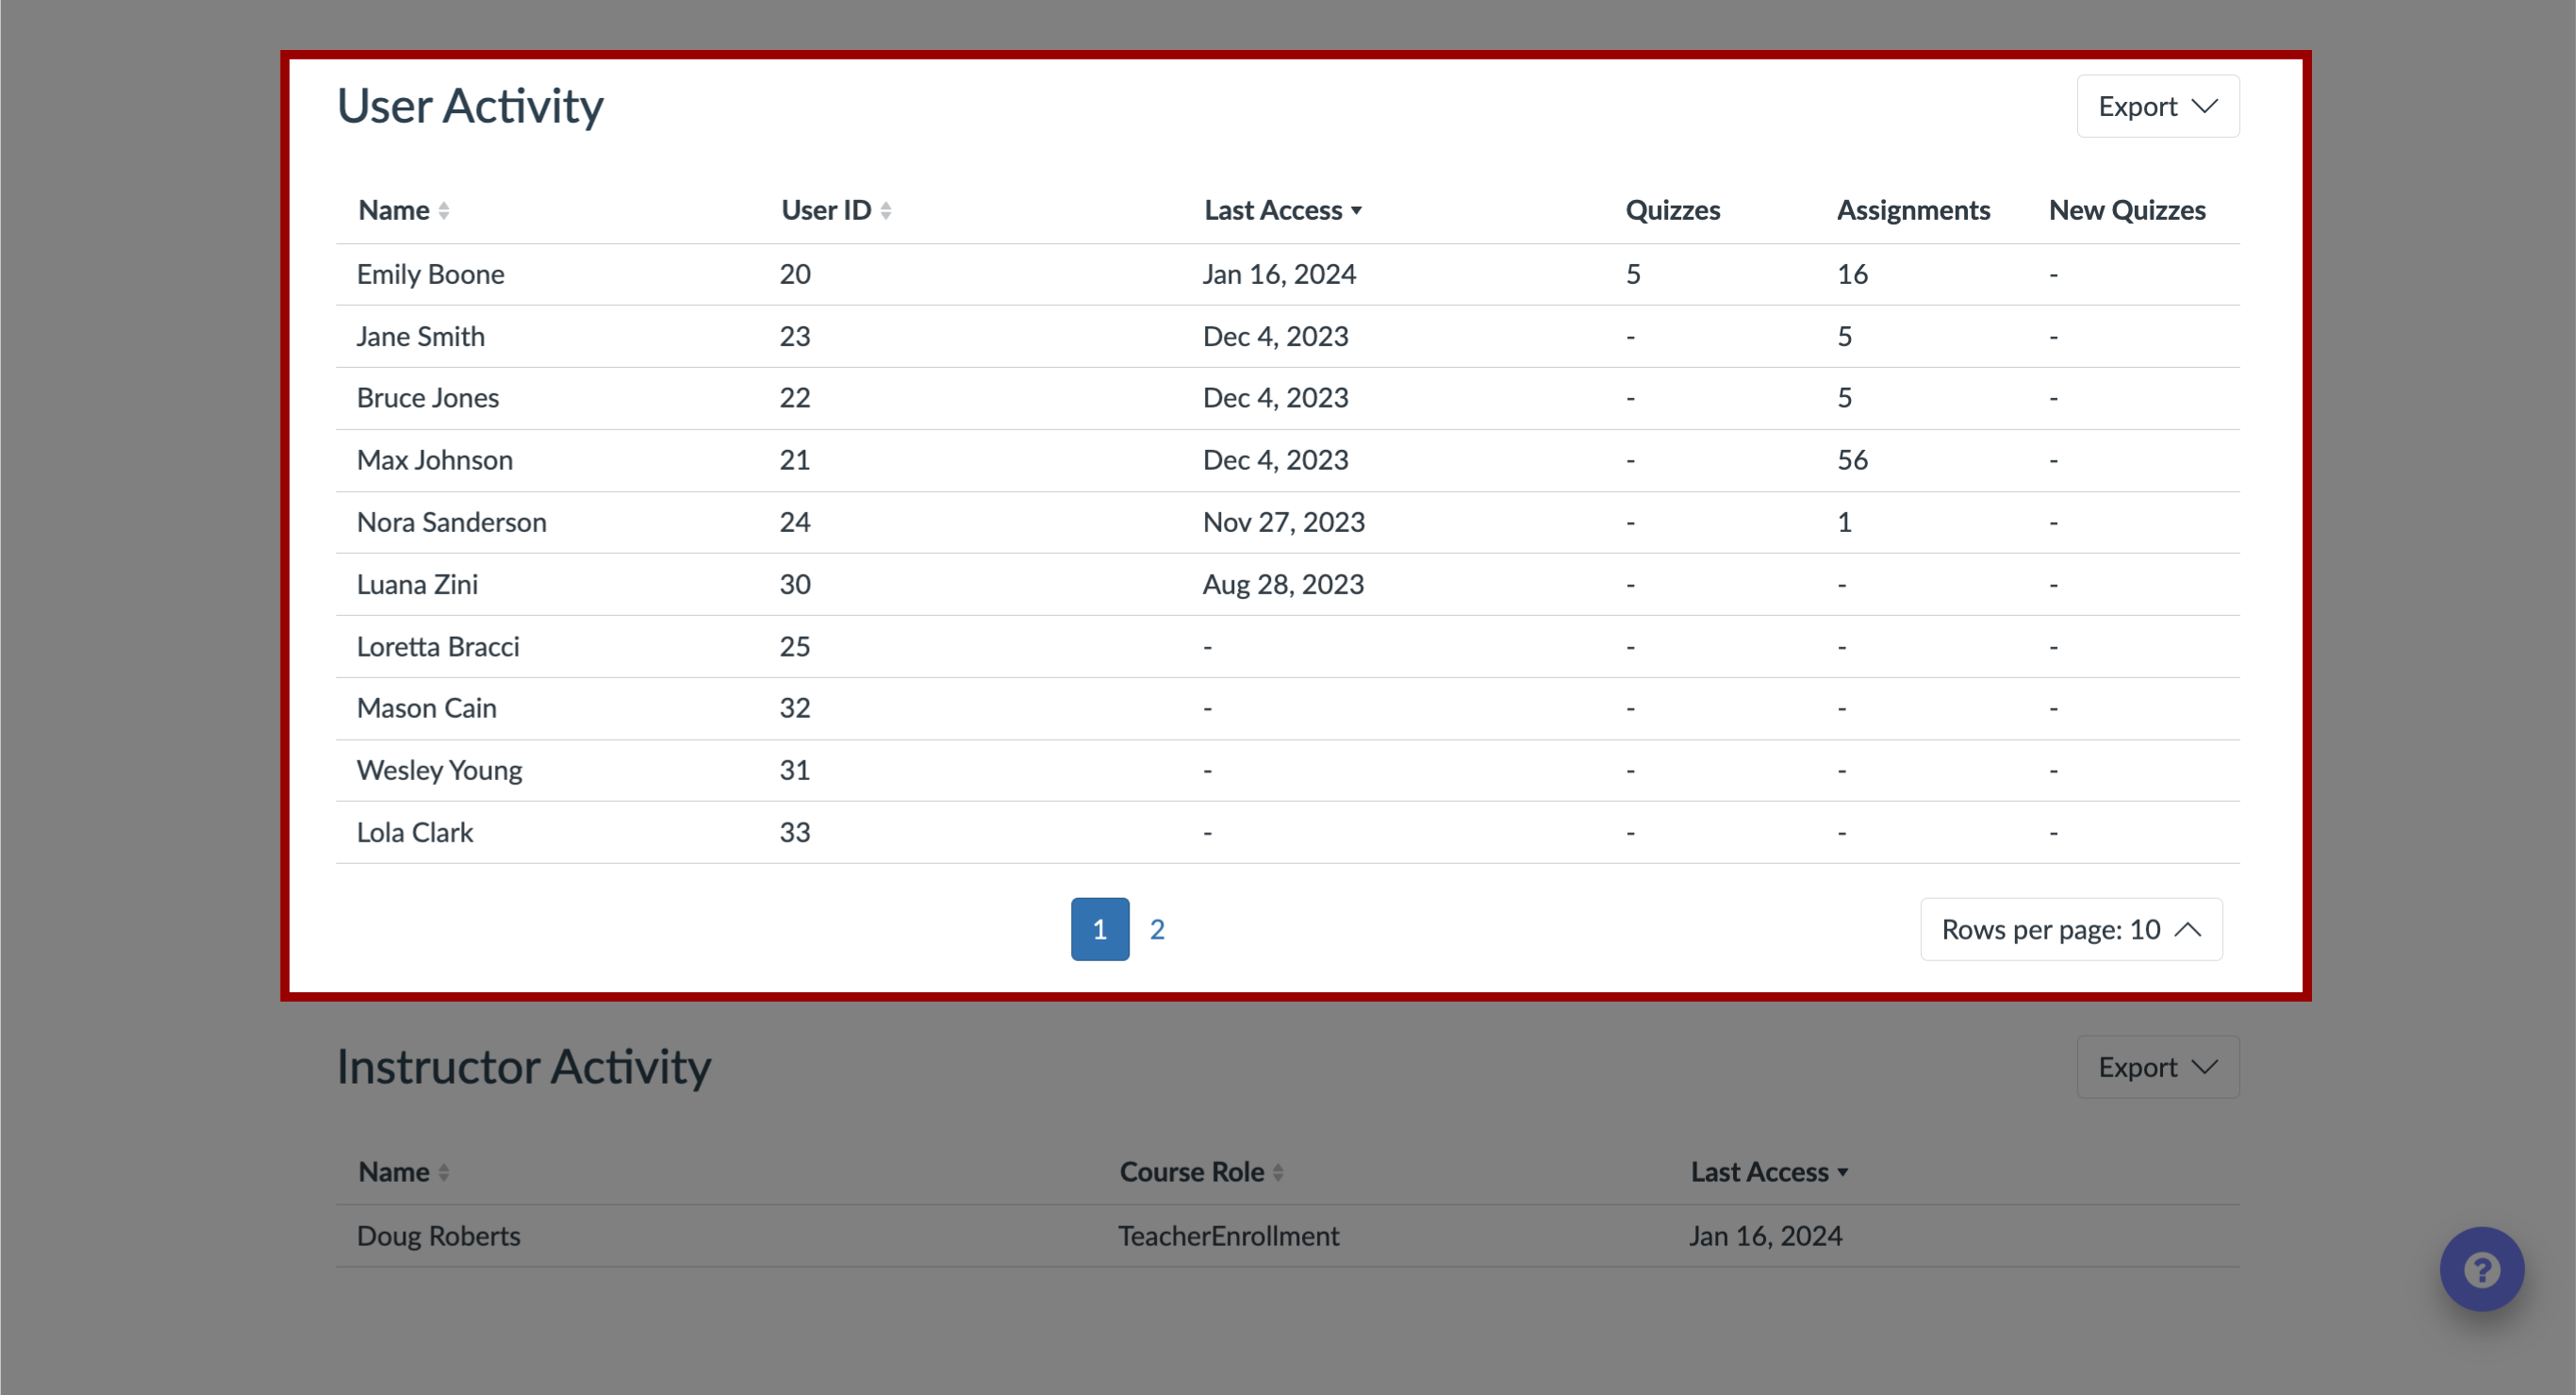
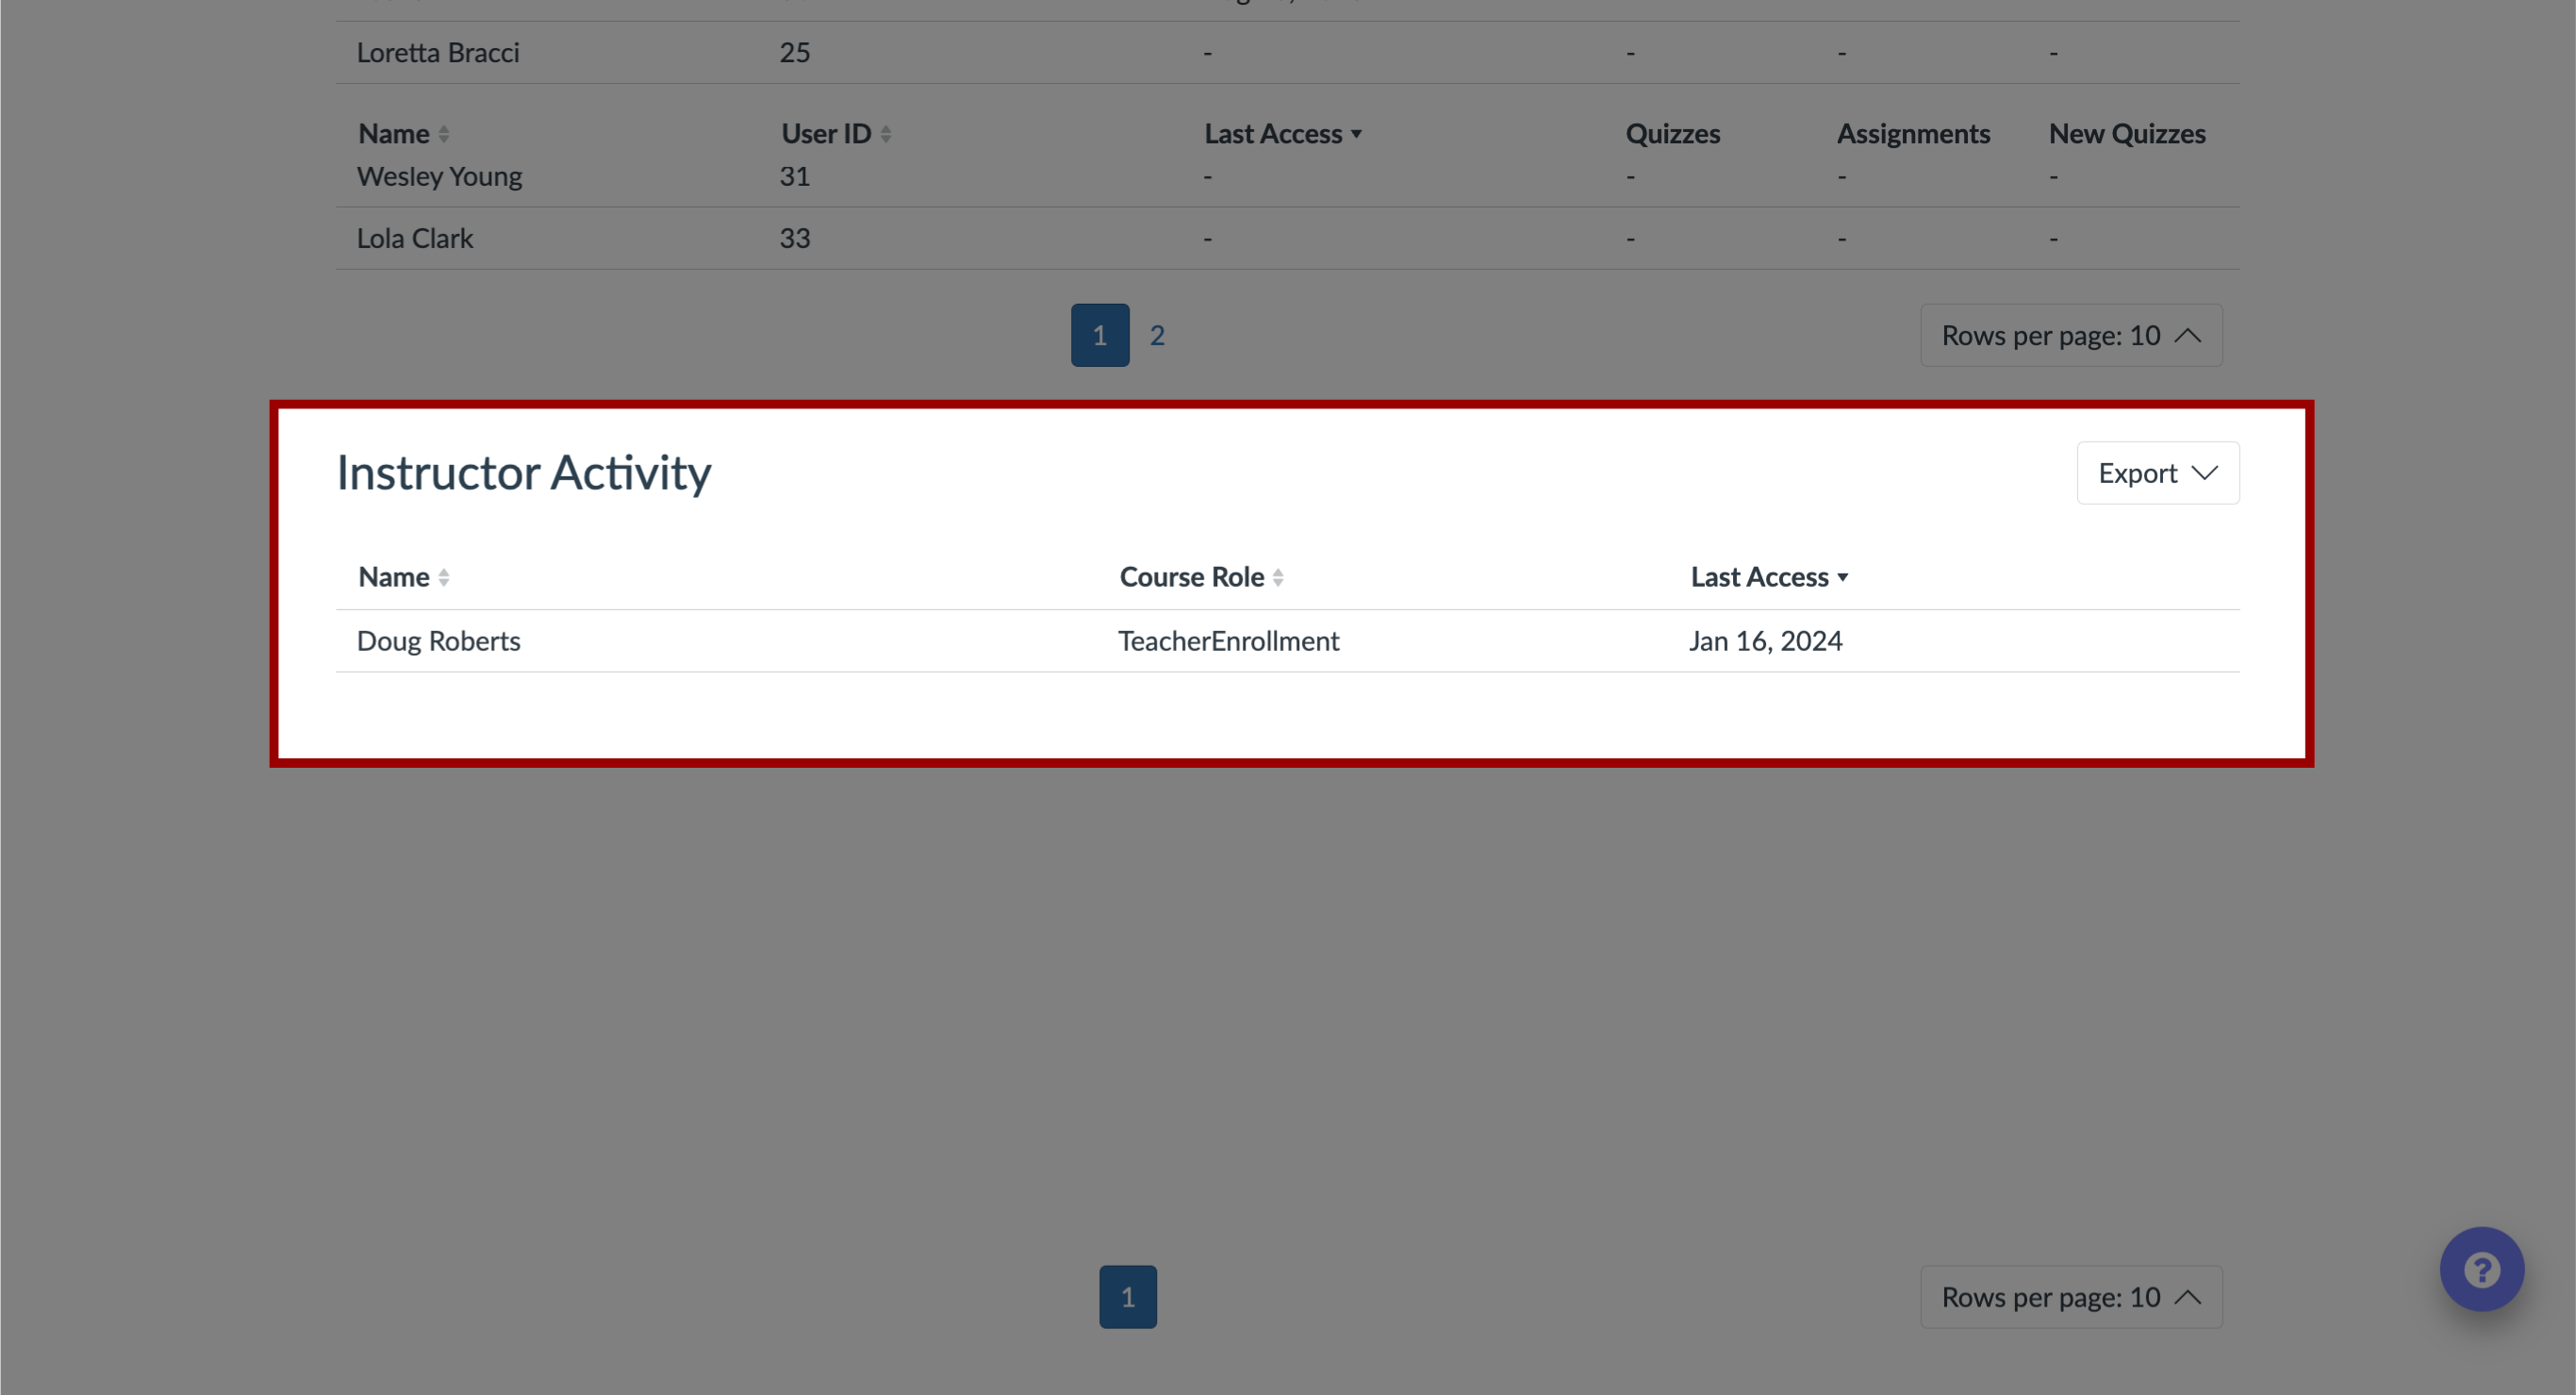
20. Instructor Activity
For each instructor, the table displays the following data:
Name: name of the instructor
Course Role: role of the instructor
Last Access: the date the user last accessed the course
To export the data, click the Export drop-down menu.